


The Australian State of the Climate 2020 report reveals a picture of long-term climate trends and climate variability.
The biennial climate snapshot draws on the latest observations and climate research from the marine, atmospheric and terrestrial monitoring programs at CSIRO and Bureau of Meteorology.
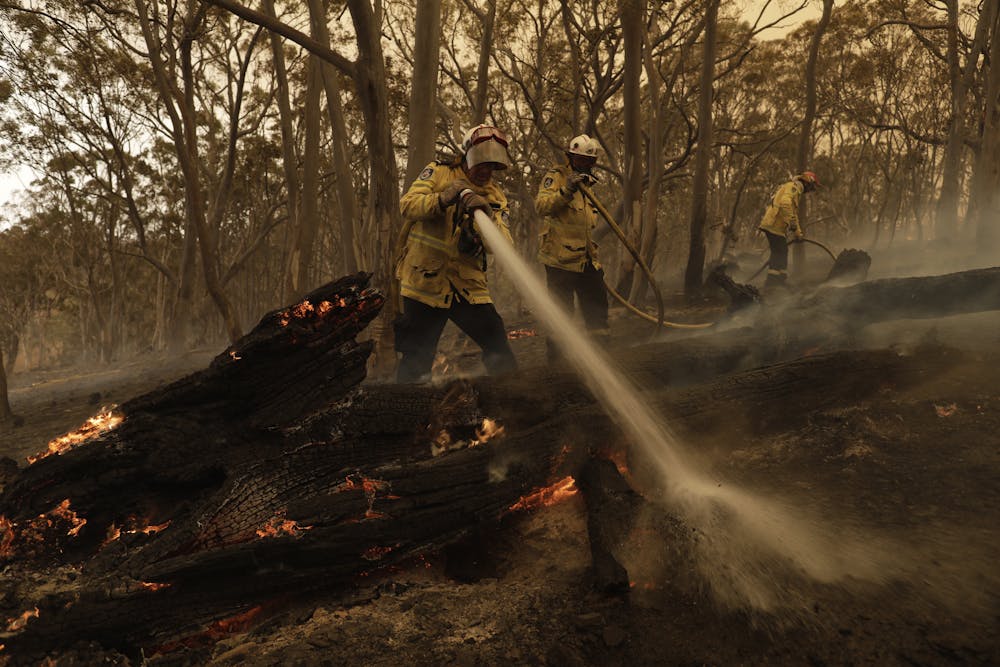
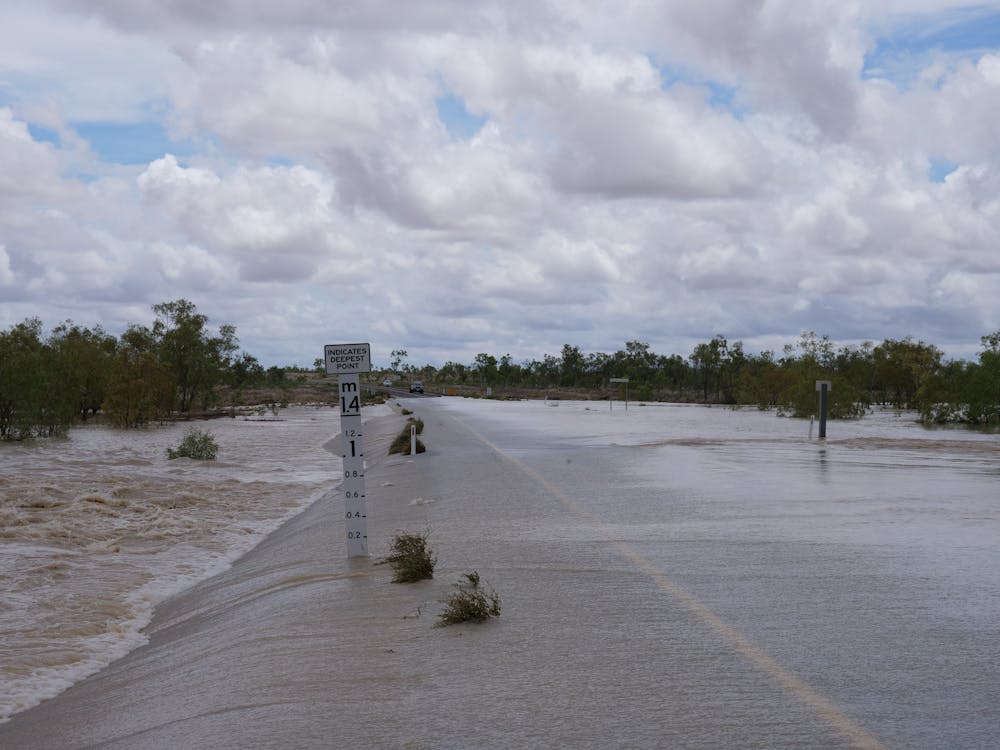
We are all still dealing with the lasting impacts of Australia’s hottest and driest year on record in 2019. It was a year of intensifying drought over eastern Australia, high temperature records and the devastating bushfires of summer 2019-2020.
State of the Climate 2020 puts all these events into the longer-term context of climate change trends and key climate drivers.
Australia’s hottest year on record
Using the best available data, the Bureau of Meteorology estimates Australia has warmed on average by 1.44°C (±0.24°C) between 1910 and 2019.
Read more: Weather bureau says hottest, driest year on record led to extreme bushfire season
Global rates of warming are lower due to the inclusion of the oceans in the global average, with the oceans experiencing a relatively slower rate of warming than continental areas.
The long-term warming trend increases the likelihood of extreme events beyond our historical experience. In 2019, natural climate phenomena that drive our weather, including a strong Indian Ocean Dipole and a negative Southern Annular Mode, added to the local warming trend, setting a record for the Australian average annual temperature.
This annual temperature for Australia is similar to what we might expect in an average year if the world reaches the +1.5°C warming since pre-industrial times.
The long-term warming trend is also increasing the frequency of extreme warm days. We have seen a rise in the number of days when the Australian average temperature is within the top 1% ever recorded.
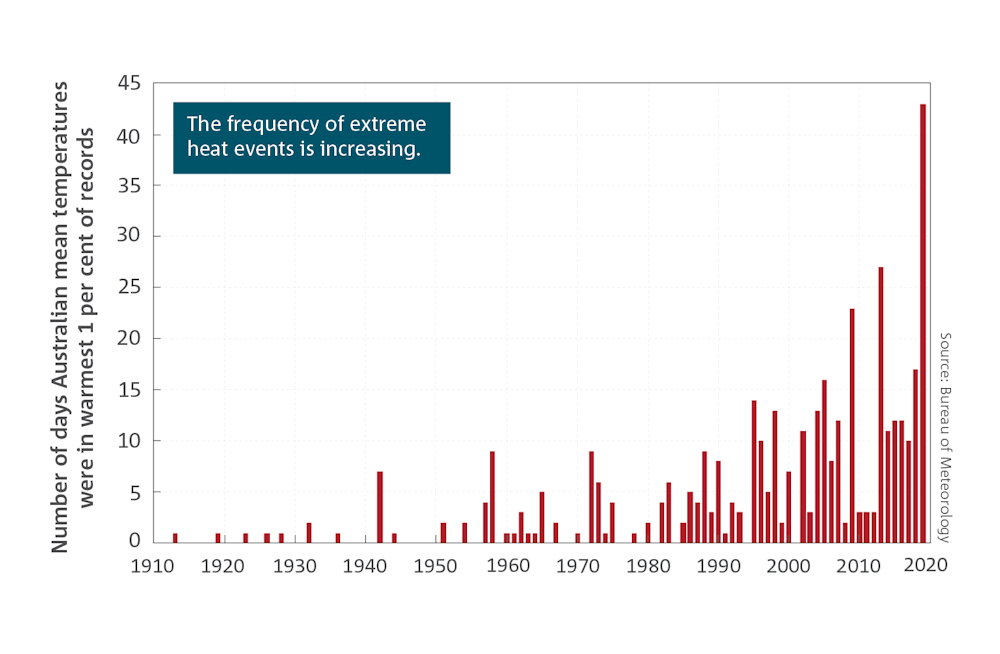
The long-term temperature trend is also lowering the frequency of cooler years. The annual mean temperatures of Australia in the seven years from 2013 to 2019 all rank in the nine warmest years since national records began in 1910.
Barring unpredictable events such as major volcanic eruptions, projections show Australia’s average temperature of 2020-2040 is very likely to be warmer than the average in 2000-2020, as the climate system continues to warm in response to greenhouse gases that are already in the atmosphere.
What’s driving our changing climate?
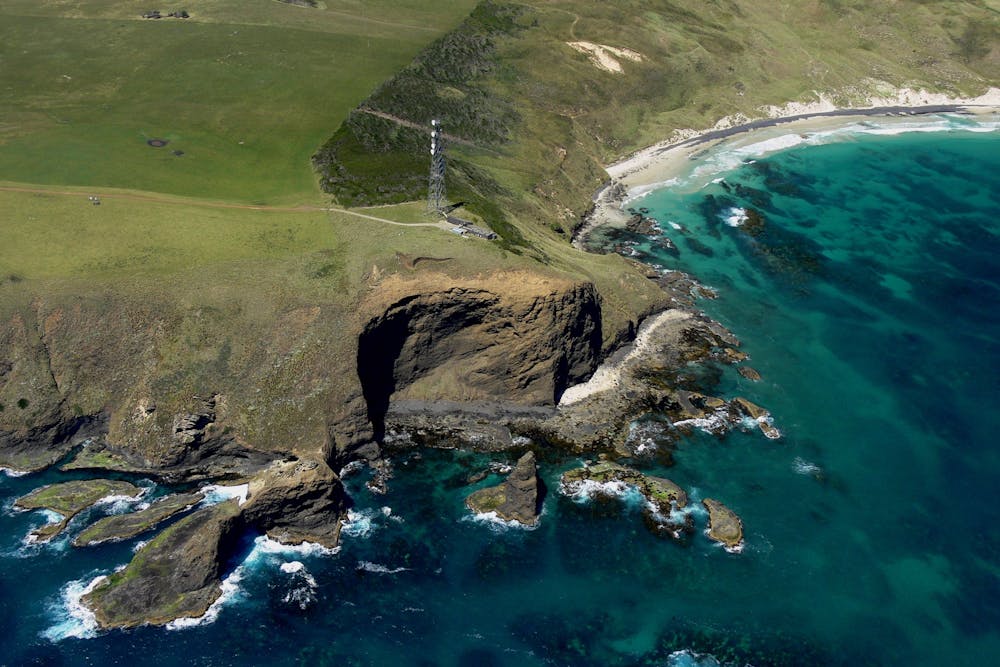
Australia’s Cape Grim atmosphere monitoring station, in north-west Tasmania, is one of several critical global observing sites for detecting changes in the gas concentrations that make up our atmosphere.
The increase in greenhouse gas concentrations has been the predominant cause of global climate warming over the last 70 years.
In 2019 the global average CO₂ concentration reached 410ppm, while all greenhouse gases combined reached 508ppm CO₂-equivalent, levels not seen for at least 2 million years.
Emissions of CO₂ from burning fossil fuels are the major source of the increase, followed by emissions from changes to land use. While the ocean and land have absorbed more than half the extra CO₂ emitted, the rest remains in the atmosphere.
The impact of the COVID-19 pandemic has reduced fossil fuel CO₂ emissions in many countries, including Australia.
Over the first three months of 2020, global CO₂ emissions declined by 8% compared to the same three months in 2019. But CO₂ is still increasing in the atmosphere.
Recent reductions in emissions due to COVID-19 have only marginally slowed the current rate of CO₂ accumulation in the atmosphere, and are barely distinguishable from natural variability in the records at sites such as Cape Grim.
Oceans warming and sea levels rising
Similar to surface temperatures over the continents, the State of the Climate report says sea surface temperatures are showing a warming trend that is contributing to an increase in marine heatwaves and the risk of coral bleaching.

Important changes are also happening below the ocean’s surface. The global oceans have a much higher heat capacity than either the land surface or atmosphere. This means they can absorb much more of the additional energy from the enhanced greenhouse effect, while warming at a relatively slower rate.
Currently, the oceans are absorbing around 90% of the excess energy in the Earth system associated with increasing greenhouse gases. The related increase in total heat content provides another important way to monitor long-term global warming.
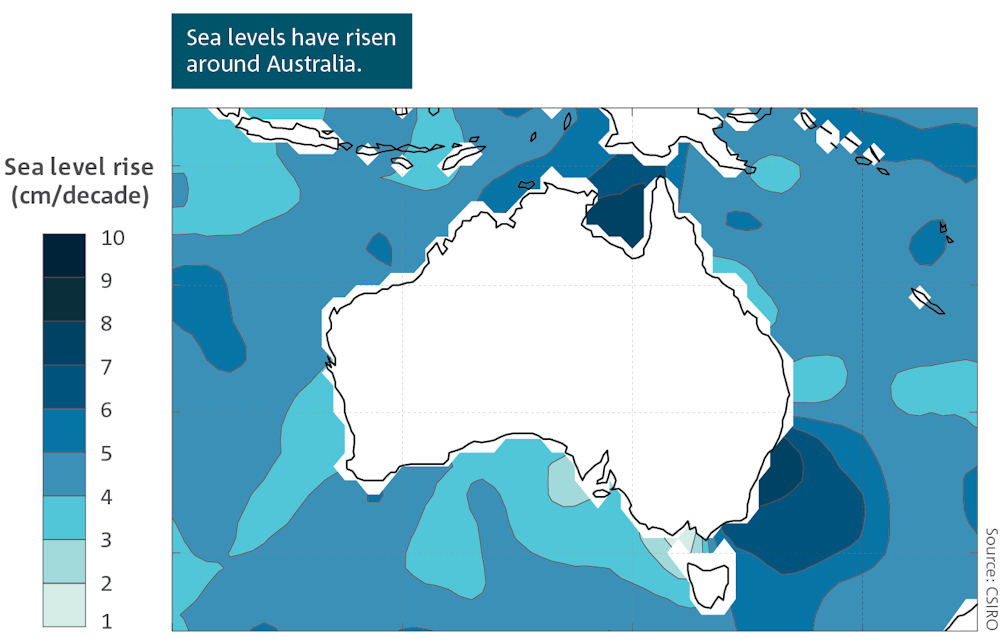
Warmer temperatures cause the water in our global oceans to expand. This expansion, combined with the additional water from melting ice sheets and glaciers, is causing sea levels to rise.
Total global average sea level has now risen around 25cm since 1880, with half of this rise occurring since 1970. The rate of sea level rise varies around Australia, with larger increases observed in the north and the southeast.
The oceans are also acidifying due to changes in the chemistry of seawater, related to excess CO₂. The effect of this pH change is detectable in areas such as the Great Barrier Reef and the Southern Ocean.
The wetter and drier parts of Australia
The State of the Climate report shows the trend in recent decades has been for less rainfall over much of southern and eastern Australia, particularly in the cooler months of the year.
The longer-term drying trend is likely to continue, particularly in the southwest and southeast of the continent. Most areas of northern Australia have had an increase in average rainfall since the 1970s.
Natural variability has always been, and will continue to be, part of Australia’s rainfall patterns.
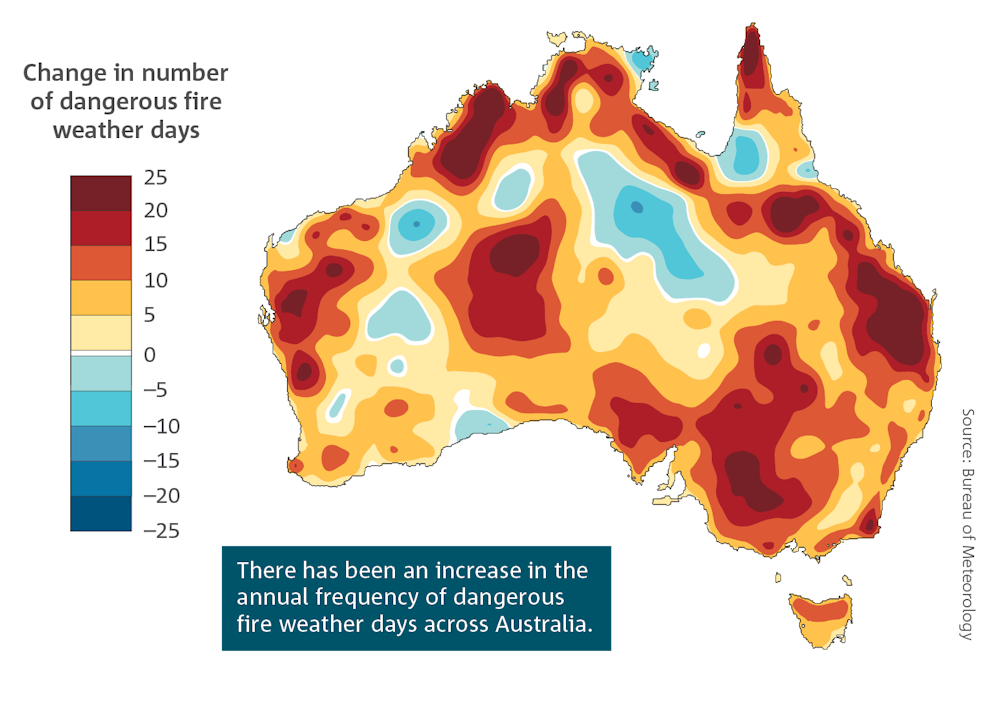
Fire seasons: longer and more intense
The fires of 2019-20 are still very much on everyone’s minds, and the State of the Climate report puts the weather component of fire risk into a longer-term perspective.
Since the middle of last century there has been a significant increase in extreme fire weather days, and longer fire seasons across many parts of Australia, especially in southern Australia.
The 2020 report highlights many recent changes in Australia’s climate. Most are expected to continue and include:
- warmer air and sea temperatures
- increased numbers of very hot days
- ongoing sea level rise
- more periods of dangerous fire weather
- longer and warmer marine heatwaves.
When these extremes occur consecutively within a short timeframe of each other, or when multiple types of extreme events coincide, the impacts can compound in severity.
Read more: Earth may temporarily pass dangerous 1.5℃ warming limit by 2024, major new report says
Understanding these climate risks and how they might affect us will help to ensure the future well-being of our Australian communities, ecosystems and economy.
State of the Climate 2020 can be read on either the Bureau of Meteorology or CSIRO websites. The online report includes an extensive list of references and useful links.