
Faced with the uncertainties surrounding climate change, policymakers and investors need to know what can happen and how likely these outcomes may be. Unfortunately, current scenarios answer only the first question – and at that, only partially. Research carried out at the EDHEC Risk Climate Institute tries to provide approximate but “actionable” answers to the second.
Climate stress testing dates back to the 1990s, when teams of scientists collaborated to create a scenario framework that was to set the analytical standards for decades to come.
They did so by sketching out a handful of narratives about how the world may evolve, socially and economically. These are now referred to as shared socioeconomic pathways (SSPs). The narratives were combined with a range of projected carbon emissions, known as representative carbon pathways (RCPs). Each narrative was run through every emission projection using process-based integrated assessment models (IAMS), which were fine-tuned on a case-by-case basis to reflect as closely as possible each of the narratives. At this point, the only degree of freedom left to match the narrative with the emission projection was the social cost of carbon – roughly speaking, the tax that should be levied on the “consumers” of carbon emissions, and whose proceeds should be channeled to emission reductions.
The SSP-RCP approach, as it is now known, was endorsed by the Intergovernmental Panel on Climate Change (IPCC) and has deservedly became a standard framework.
An analysis framework that’s showing its age
Despite its strengths, the SSP-RCP approach isn’t perfect, nor does it adequately fulfills the need of all scenario users. Indeed, two decades after their introduction, the SSP-RCP approach is showing signs of ageing.
We argue that its revision should be carried out along three distinct lines, each addressing one of the problems with the present modelling framework:
Let’s consider the narratives first. They are presented in a rich and colourful language (there is mention of “resurgent nationalism”, “growing inequality”, etc.), but the only levers at the disposal of the models that try to capture these narratives are the rates of demographic and economic growth, the carbon intensity (emissions per unit of energy) and the energy intensity (energy per unit of GDP). If each of these variables can just exist in three possible states – say, high, medium, and low – that gives us 3 x 3 x 3 x 3 = 81 narratives. So, the six narratives chosen by the IPCC are but a small subset of all the possible worlds that may occur.
Could the IPCC’s six narratives be the most likely ones? We cannot tell, because no probabilities were associated to the scenarios – and this, we contend, is the second big shortcoming of current scenarios. Without any probabilistic information, we cannot tell which scenarios we should really worry about, and which can be safely set aside.
The third problem is the modelling choice in the SSP/RCP set-up, where each narrative is associated with the most likely trajectory for each of the driving variables. This is reasonable, but fails to convey the huge uncertainty around the key estimates. This creates a misplaced sense of predictability, often expressed in tenth-of-degree precision. In reality, knowing how uncertain we are about an outcome can be as important as knowing the expected value for this outcome.
Doing better
How can these shortcomings be fixed? An attractive strategy can be sketched along the following lines. First, we can simplify the problem by recognizing that carbon intensity, energy intensity and the rate of demographic growth are all linked to how rich a region is: richer countries tend to have lower fertility; to use more services than goods (lowering their carbon footprint); and to use fewer emissions to generate one unit of energy.
So if we can model economic growth (and its uncertainty!), we can estimate GDP per person on the one hand, and all the other main drivers of climate change on the other. This is helpful, because economists have devoted decades of work to modelling economic growth – work that can be adapted to the needs of climate-scenario modelling, allowing us to estimate with some confidence how GDP per person evolves over time (after taking climate damages into account). From this we can infer how population growth and the decarbonization of the economy are likely to evolve. While challenging, the task is well defined.
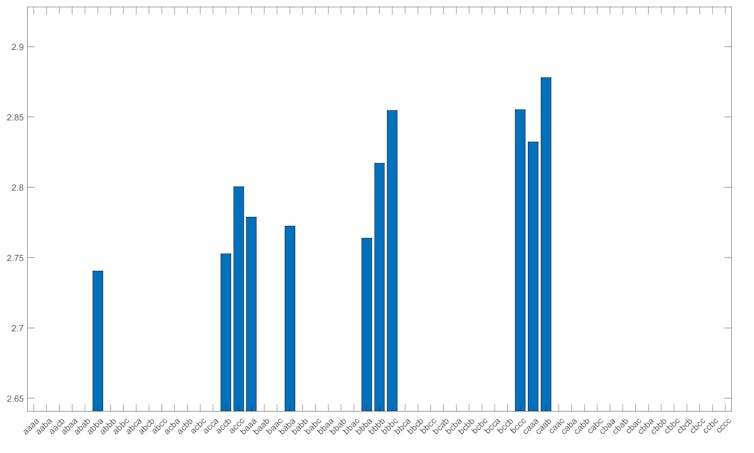
Figures 1 and 2 give an idea of what this approach can yield. To create them, we have assumed that each of the four key variables (economic growth, carbon intensity, energy intensity and population growth, in order) can exist in a “low”, “medium” or “high” state (associated with the first, second, or third tercile of their distributions, respectively, and labelled a, b and c). Figure 1 then shows the 10 most likely scenarios, and Figure 2 displays the average temperature in each of these scenarios (given an emission pathway).
Temperatures in the various scenarios

An example of one question this analysis can answer is the following: are lower temperatures obtained in states of high or low economic growth? The answer is not obvious, because high GDP generates more emissions, but also reduces population growth and carbon and energy intensities. This means that there is a tug of war between economic growth (with the attending increased use of energy), and the reduction in carbon intensity and population growth associated with richer economies.
Figure 2 reveals that the higher temperatures occur in the states of high economic growth, suggesting that – as least for the abatement schedule examined and the model used – the GDP effect dominates: we cannot just grow our way out of our climate predicament.
Scenario probabilities
What we have presented should not be regarded as the final word on the matter, but as a work in progress project. Despite its limitations, we think our approach is a useful first step in the probabilistic direction toward which scenarios must move.