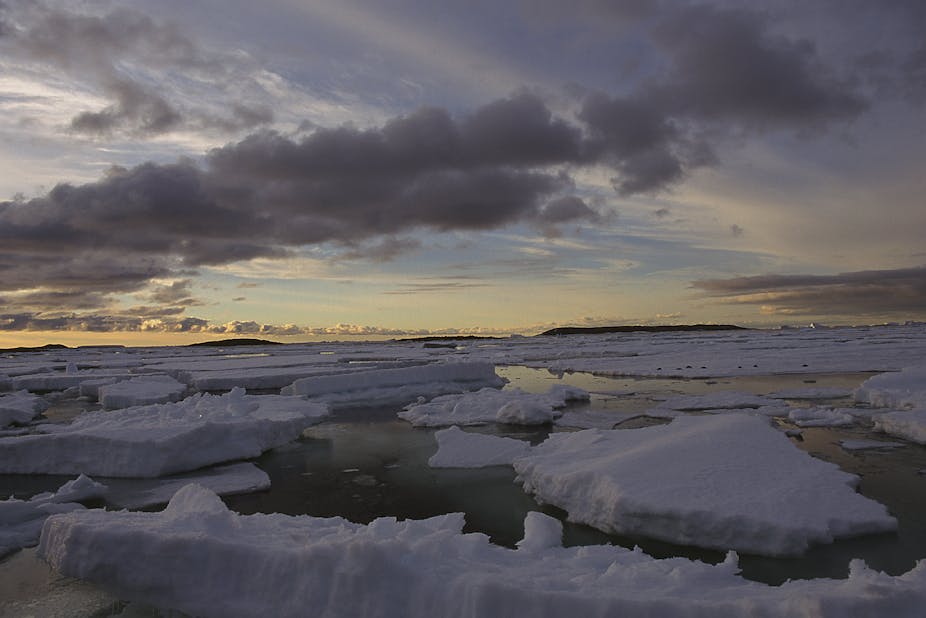
A small slice of Antarctica turns up along your coastline each year.
We’re all glad it’s just a small slice, given Antarctica could deliver a total sea-level rise of 59 metres. That’s not going to happen any time soon, but exactly how small is today’s contribution?
Recent work that used satellite data to “weigh” changes in the Antarctic ice sheet suggests a dramatic revision to some previous estimates. This revision was based not just on a better understanding of the motion of ice but also of rock.
Where does sea-level rise come from?
Sea-levels have risen over the last 20 years at a rate that is as fast as we’ve seen in the last century. And the last century has seen faster sea-level rise than at any time in the last several thousand years.
Rising temperatures has driven thermal expansion of the oceans and the overwhelming and dramatic retreat of small glaciers. Melting of Greenland due to warming of the atmosphere and oceans is now causing sea levels to rise from this source alone by about 0.7 millimetres-per-year - up from closer to zero 20 years ago.
But the picture is not the same everywhere and scientists are still debating the exact role of Antarctica in recent sea-level change.
Weighing Antarctica
That was the topic of a study that colleagues and I report on in a paper published recently in the scientific journal Nature. We made use of data from the remarkable Gravity Recovery and Climate Experiment (GRACE) satellite mission, which allows us to produce maps of the Earth’s gravity field. Because gravity changes at a particular location when mass moves around, GRACE allows us to “weigh” changes in the ice sheets.
Our weigh-in reveals how much ice is being shifted into the oceans from Antarctica over the period when GRACE data exist - from 2002 to 2010. It’s a loss of 69 billion tonnes per year, on average. That is about 190 million tonnes per day or, if you spread it evenly across the ocean surface, about 0.2 millimetres-per-year of sea-level change.
Rock going up and ice going down
GRACE has been used to determine Antarctica’s contribution to sea-level change several times before. But our estimate is a significant revision to previous studies which suggested a 2-3 times higher rate of mass loss. The reason for the difference highlights the difficulty of working with GRACE but also the advance of our study.
The challenge with GRACE is that it doesn’t measure changes in ice mass after all. It measures total mass change in a column extending all the way from the atmosphere to within the Earth. And so to obtain ice-mass change we needed to subtract off the effects of mass changes in the atmosphere, the oceans and, surprisingly to many, the solid earth itself.
While rock seem hard to most of us, it also changes shape as it is subjected to large forces. Twenty-thousand years ago, at the Last Glacial Maximum (LGM), much more ice was stored on land than today - often hundreds of metres more. The bedrock beneath the Antarctic ice experienced the force of that extra load. That resulted in gradual flow of mantle material away from the region in a process known as glacial isostatic adjustment (GIA).
As the ice load reduced over the next thousands of years, the load was removed and the mantle material began to flow back beneath Antarctica. That flow of material is measured by GRACE. Knowing how fast that is happening is the key to understanding ice mass change using GRACE.
A new estimate of mass change within the earth
Over the last decade a series of field data-sets revealed that Antarctica’s ice sheet wasn’t as large at the LGM as previous evidence had suggested. Incorporating this into a model of GIA gave systematically smaller rates of mass change within the earth.
At the same time, new Global Positioning System (GPS) measurements of present-day bedrock motion became available. These validated the new model and justified our use of it to subtract from GRACE data the mass change due to GIA to obtain ice mass change. Subtracting a smaller rate of rock mass change resulted in a smaller rate of ice mass change, allowing us to arrive at our figure of 0.2 millimetres-per-year.
But it’s wrong to assume Antarctica is changing at the same rate everywhere. Antarctica is big - one and a half times bigger than Australia - and there are important details. Large losses in the west are being partially offset by extra accumulation in the east. Perhaps most importantly is that the area losing the most is also seeing an acceleration in that loss.
While the slice of Antarctica turning up on our coastlines may be relatively small now, it may not be small for much longer.

