

On Christmas Day in Australia, fewer people are at their paid employment and more working premises are closed than on any other day in the year. How does this affect demand for electricity, widely seen as fundamentally associated with economic activity?
Looking at operational data for the National Electricity Market (NEM) sheds interesting light on how patterns of electricity demand and supply in Australia are changing, as well as on some features which appear unchanging.
Total electrical energy used on Christmas Day last year, in Victoria and SA, was the smallest for the entire year. In NSW, total energy consumption was slightly lower on Boxing Day. In Queensland, two Sundays in early September were lower, but only just.
So minimum economic activity does, more or less, correlate with minimum electrical energy consumption.
That generalisation applies across the whole year. Over Easter, the other extended holiday period, daily energy consumption is markedly lower than on an average working day. And energy consumption on weekends and other public holidays is also, on average, lower than on working days.
Perhaps more surprising is the fact that electrical energy consumption on Christmas Day remains such a high proportion of annual average working day consumption. In NSW, consumption on Christmas Day 2012 was 77% of average working day consumption during the year. In Victoria and SA it was 71% and in Queensland it was 85%.
Either there is a large increase in residential electricity consumption when there are more people at home throughout the day. Or, businesses have a large degree energy consumption “inertia”.
In fact, both factors are at work. But their relative importance will vary with location across electricity distribution networks.

Understanding the relative size of these effects could help determine energy and greenhouse emissions policy. For example, energy audits of schools often find high levels of energy consumption even during holidays when there are few people in the buildings. This is either because of poor energy management practices, or lack of suitable controls on energy-using plant and equipment.
Only the individual electricity network businesses have the detailed spatial data needed to determine whether such consumption patterns are common. But if they are, this could be an excellent, low-cost way to reduce energy use in these locations, and thus reduce power station emissions. Businesses could even apply for funding through the proposed Emissions Reduction Fund (“direct action”).
Looking at electricity consumption on Christmas Day is also a good way of understanding the effects of air conditioning.
In Queensland, air conditioning is responsible for a large fraction of total electricity demand during summer but, because of the climate, the demand does not vary greatly from day to day. But in NSW, Victoria and SA, in increasing order, day-to-day variation in summer temperatures cause very large variations in daily electrical energy consumption and even larger variations in daily peaks.
The Christmas-New Year period of 2007-08, when Christmas and New Year Days were on Tuesday, provides a very clear example. In Melbourne, Christmas Day was cool (maximum 19C) and New Years Day was hot (maximum 40C). The graph shows daily NEM peak electricity demand in Victoria and maximum daily temperature in Melbourne.
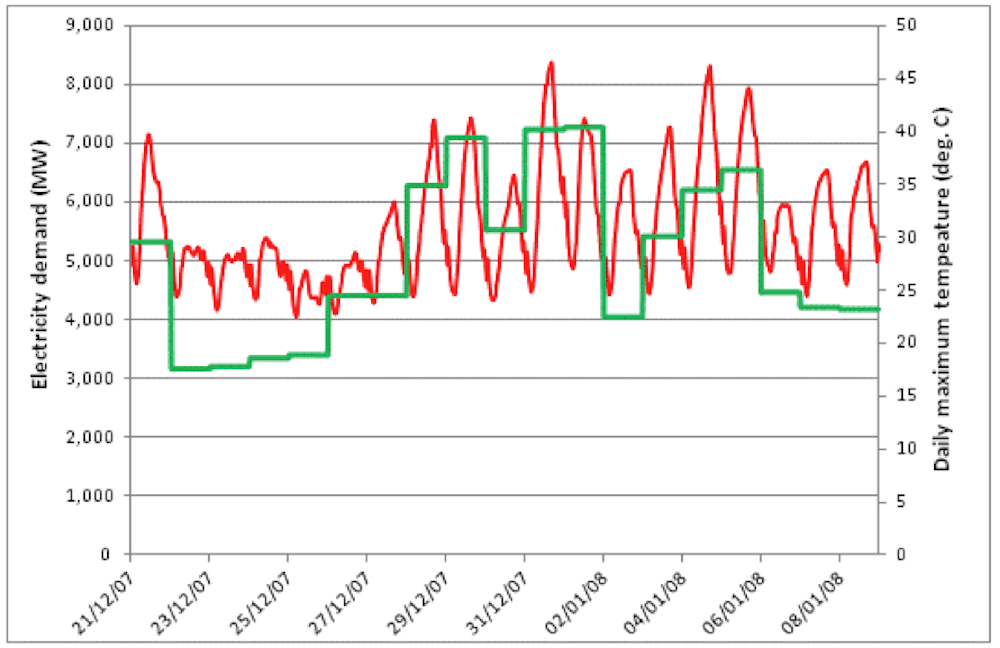
Demand was very low on Christmas Day and Boxing Day, when it was cool, but high on New Year’s Day when it was very hot. Indeed maximum demand on New Year’s Day was higher than on each of the two following working days and also than the first three day of the following working week, on all of which it was cooler. Similar relationships can be seen when the weekends are compared.
Daily electrical energy shows a similar pattern, though the variation between highest and lowest is less extreme. While peak demand was 73% higher on New Year’s Eve than on Christmas Day, total energy was only 45% higher. Similar relationships can be seen around the Australia Day public holiday and over weekends in January, February and March in all three southern states (though not in Tasmania where the use of air conditioning is very much lower).
Obviously, when it is hot, daily weather has a larger effect on electricity consumption than whether the hot day is a public holiday, a weekend or a normal weekday. Equally obviously, it is peak demand on hot days which determines how much distribution network capacity is required.
From the perspective of 2013, this example comes with both good news and bad news. The good news is that since 2008 the average efficiency of new air conditioning systems has increased considerably. As the stock of old units is gradually replaced the quantity of electricity required to deliver a given level of cooling will decrease.
The bad news is that in 2008 growth of peak demand on hot days was expected to continue unabated. Network businesses got regulatory approval to build and recover the costs of this capacity, most of it has been built (even if it is not now needed) and electricity consumers are nevertheless paying for it.
The second graph looks at South Australia and compares Christmas 2007 with Christmas 2012; Christmas Day was on Tuesday in both years. The most obvious feature is the enormous change in peak demand from Sunday 23 to Monday 24 in 201, confirming the extreme temperature sensitivity of electricity demand in the state.
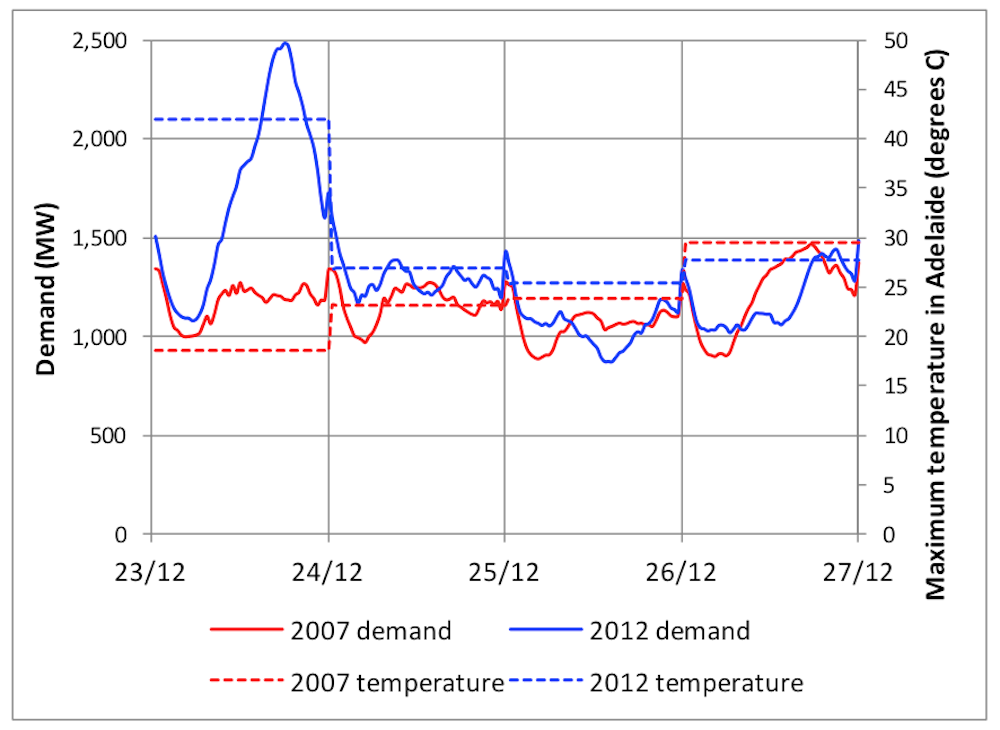
Perhaps the most interesting feature, however, is the change in the shape of the daily load curve on December 25 and 26, which were mild sunny days in both years.
In 2008, minimum daily demand occurred at 4.30am, which until recently has been the normal pattern in SA and throughout Australia. In 2012, however, the daily minimum was at 2.30pm.
This radical change is clearly caused by supply from rooftop photovoltaic installations; these are not included in data for National Electricity Market operations. On most weekends and public holidays, unless it is very hot, very cold or very cloudy, the daily load profile in SA now resembles that on Christmas Day 2012.
In recent months this pattern has begun to also appear on some working weekdays, such as Tuesday 15 and Friday 18 October 2013. Moreover, on some days the daily peak occurs at midnight, when so-called off-peak electric water heaters (clearly now a gross misnomer) are automatically switched on.
For several years, AEMO (the electricity market operator) has been laboriously developing proposals to change the electricity market rules so consumers can temporarily curtail their demand at times of high system demand. This is known as a demand response mechanism. At its meeting on Friday December 13 the Standing Council on Energy and Resources was asked to endorse this kind of rule change. It declined to do so, asking instead for further study.
It is hard to avoid the suspicion that ministers, particularly those from NSW, Queensland and WA, whose governments own and derive significant revenue from the electricity networks in their states, see any demand reduction as a threat to these revenues.
Here’s a radical thought. Instead of charging PV owners whose systems help to flatten the daily load curve, why not levy a capacity (per kW) charge on owners of large residential air conditioners. This would ensure that those whose demand for energy was the main reason for overbuilding network capacity paid for what was built for their comfort and convenience.
If thoroughly implemented, it could do much more than repeal of the carbon price to reduce the cost of electricity for low income consumers without air conditioning. And that would be a great Christmas present.