

In many nations in the immediate post-war period, women were more often supporters of rightwing parties than men. This “traditional” gender gap was supposedly underpinned by women’s greater religiosity and lower exposure to the social institutions of the left, such as trade unions.
However, in many wealthy nations, a “modern” gender gap has emerged. Women in these nations are more likely to support leftwing parties than men. For example in the US, a greater proportion of women than men have voted for the Democratic presidential candidate in every election since 1980.
When seeking to explain why women and men vote differently, research has long emphasised the role of gendered values change. This is the idea that generation by generation, our values shift and our political leanings also shift to fit those new values.
But in a chapter for this year’s British Social Attitudes survey, we’ve found that in the UK, the gender gap in voting seems more tied to changing events than changing values.
Political scientists Ronald Inglehart and Pippa Norris described women’s leftward shift as a generational process. In this model, younger cohorts of women, who have experienced higher labour force participation, higher education, and less traditional gender roles, become more economically left-leaning, socially liberal and supportive of gender equality. This pushes them to the left of men in their party choices.
The British two-party gender gap, 1945–2019:

That shift has only happened in the UK very recently. Data from the British Election Study indicates that women were more likely to vote for the Conservative party than men right up until the 2017 general election, when they became more likely to vote Labour than men. And we have reason to believe that the shift is not because women’s values have changed over generations.
Gender gap in partisan identification, by generation, 1983-2022:

The British Social Attitudes survey contains a long-term measure of party identification that allows us to test underlying patterns of support for the two largest parties. This data provides some evidence that the emergence of the modern gender gap in recent years is the product of underlying generational differences.
In general, the gaps for the two youngest generations tend to be above zero, indicating higher support for Labour among women in these groups. And the gaps for these generations reach up to around 15 percentage points.
In contrast, the gaps for the two oldest generations are more often below zero, indicating higher support for the Conservatives among women of these generations. The generational divide in the gender gap is particularly evident from the mid-2000s onwards. Prior to this, there are fewer generational differences in the gender gap.
Did we change – or did you?
However, while there is a generational gap, it does not appear to be based on changing values. We find no evidence that economic or social attitudes exhibit similar gendered generational patterns.
For example, although women are slightly more likely than men to support higher taxation and spending on public services, this is true across the generations. The gender gap itself does not increase among younger cohorts.
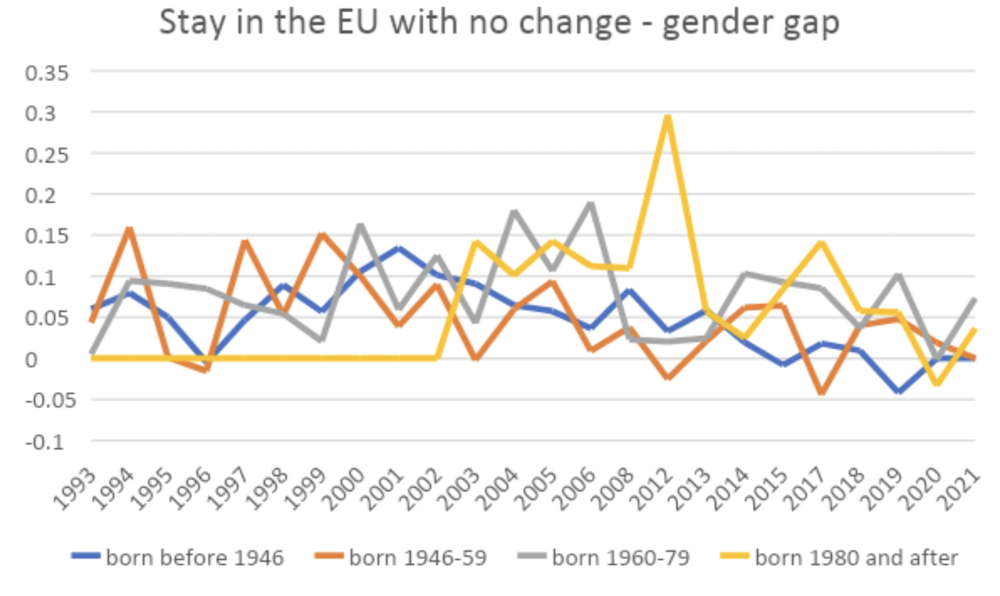
Instead we find that gender differences in attitudes towards Britain’s membership of the EU are a potentially more powerful explanation. Overall, women more often reported wanting to stay in the EU with no change in its powers than men. But this difference between men and women is generally larger and more consistent for the younger (1960-79 and post-1980) generations than for the oldest.
So in the younger age cohorts, a greater proportion of women than men were committed to staying in the EU in 2017 and 2019. This may account for the emergence of the gender gap in party support.
There is a difference between men and women in the older generations on wanting to stay in the EU, but this gap tends to reduce from the mid-2000s. After 2019, there was more convergence between the sexes across generations (with differences between men and women reducing), perhaps reflecting the fact that Brexit has fallen in salience.
Gender gaps in attitudes to the European Union, by generation, 1983-2022:
The gender gap in party support that emerged in the 2017 and 2019 elections may therefore be the result of the interaction between electoral context, including party policy and pre-existing gender gaps in attitudes and values, such as the greater support for the EU evident among younger cohorts of women than men. Both campaigns were fought around Brexit, after all.
Our findings are in keeping with recent research that has shown that the salient political issues of the day, including attitudes towards Brexit and public services such as the NHS, and financial and economic concerns are more powerful explanations of the gender gap in party support than long-term values change.
This suggests that Labour cannot afford to be complacent about women voters. Their switch is not necessarily a natural generational trajectory and their support in the next election is not guaranteed if they don’t like the party’s policy positions.