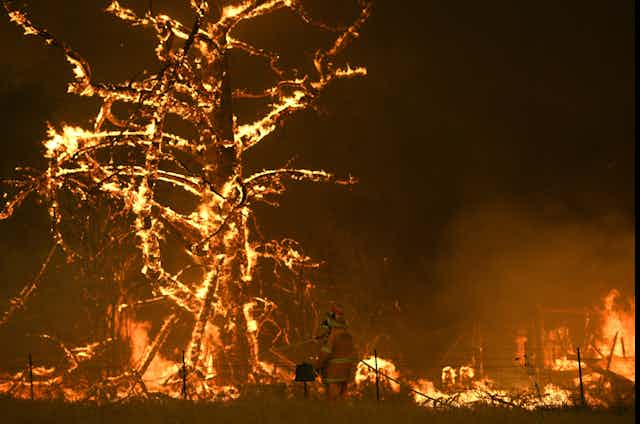


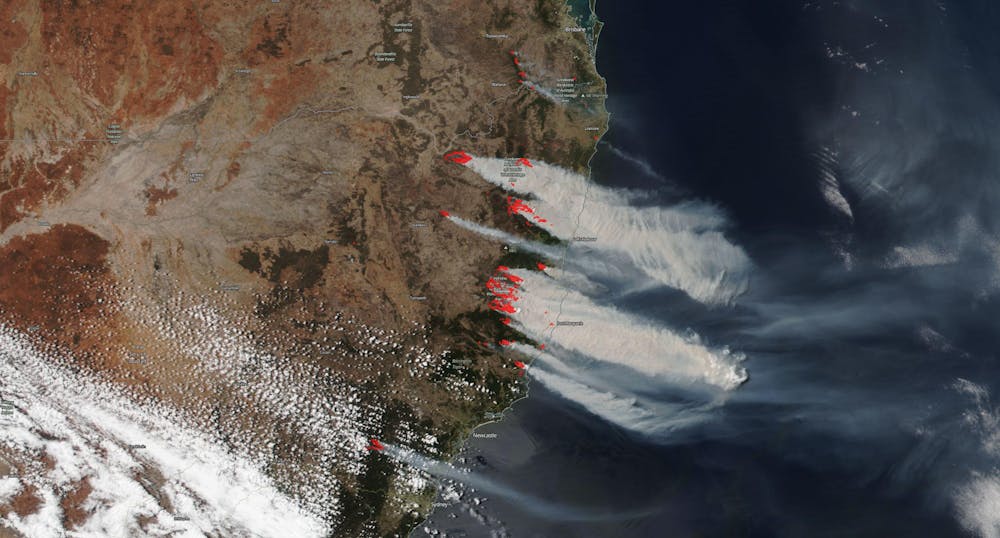
The Black Summer forest fires of 2019–2020 burned more than 24 million hectares, directly causing 33 deaths and almost 450 more from smoke inhalation.
But were these fires unprecedented? You might remember sceptics questioning the idea that the Black Summer fires really were worse than conflagrations like the 1939 Black Friday fires in Victoria.
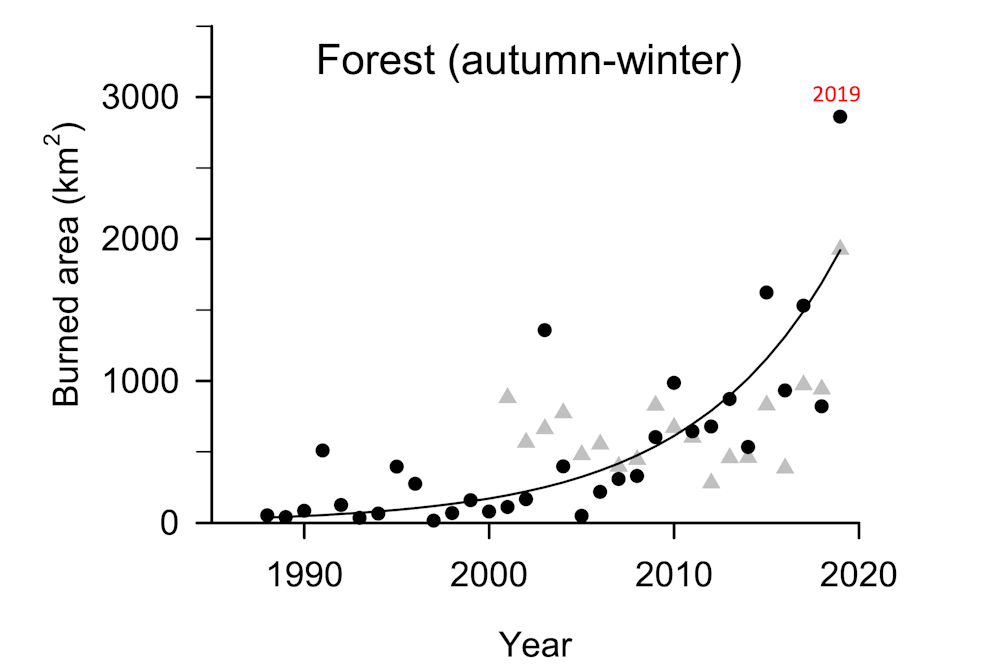
We can now confidently say that these fires were far from normal. Our new analysis of Australian forest fire trends just published in Nature Communications confirms for the first time the Black Summer fires are part of a clear trend of worsening fire weather and ever-larger forest areas burned by fires.
What did we find?
Our study found that the annual area burned by fire across Australia’s forests has been increasing by about 48,000 ha per year over the last three decades. After five years, that would be roughly the size of the entire Australian Capital Territory (235,000 hectares).
We found three out of four extreme forest fire years since states started keeping records 90 years ago have occurred since 2002.
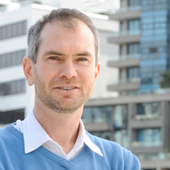
And we found that the fire season is growing, moving out of spring and summer into autumn and winter.
These trends are almost entirely due to Australia’s increasingly severe fire weather and are consistent with predicted human-induced climate change.
Our study is based on satellite and ground-based estimates of burnt forest area, and trends of nine wildfire risk factors and indices that relate to characteristics of fuel loads, fire weather, extreme fire behaviour, and ignition.
We have focused here only on the most dangerous forest fires, not the fires affecting Australia’s savanna across the tropical north.
Fire burns much more land than 25 years ago
Before the 1990s, Australia’s forest fires were infrequent, though damaging. A given area would burn at an interval between 20 to over 100 years.
The exception were rare summers which would see severe and extensive fires, such as 1939. Overall, only a small fraction of the total forest area burned in any year.
This pattern of fire behaviour no longer exists.
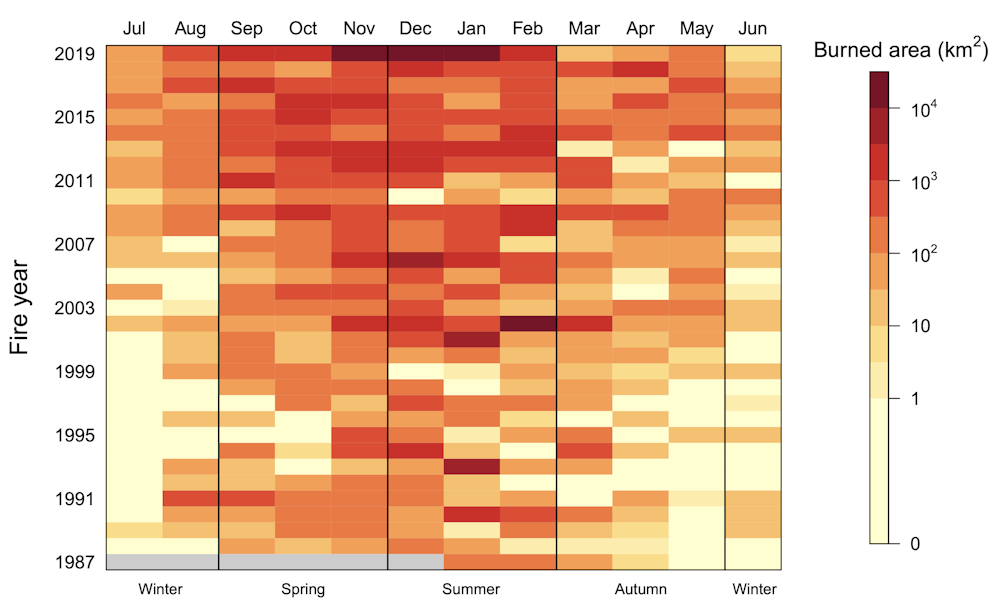
Over the last 30 years, the areas affected by fire have grown enormously.
If we compare the satellite records from 1988–2001 to the period from 2002–2018, the annual average fire area has shot up by 350%.
If we include the 2019–20 Black Summer fires, that figure soars to 800% – an enormous leap.
We are seeing fires growing the most in areas once less likely to be affected by fire, such as cool wet Tasmanian forests unaccustomed to large fires as well as the warmest forests in Queensland previously kept safe from fire by rainfall and a humid microclimate. This includes ancient Gondwanan rainforests not adapted for fire.
Read more: A staggering 1.8 million hectares burned in 'high-severity' fires during Australia's Black Summer
More extreme fire years and longer fire seasons
Before 2002, there was just one megafire year in the 90 years Australian states have been keeping records – and that was 1939.
Since 2001, there have been three megafire years, defined as a year in which more than one million hectares burn.
Our fire seasons are also getting longer. Spring and summer used to be the time most forest fires would start. That’s no longer guaranteed.
Since 2001 winter fires have soared five-fold compared to 1988–2001 and autumn fires three-fold.
Overall, fires in the cooler months of March to August are growing exponentially at 14% a year.
What’s driving these changes?
Imagine a forest fire starts from a lightning strike in remote bushland. What are the factors which would make it grow, spread and intensify?
A fire will get larger and more dangerous if it has access to more fuel (dry grass, fallen limbs and bark), and if the fire starts when the weather is hotter, drier and windier. Topography also plays a role, with fire able to move much faster uphill.
To get a sense of the overall risk of forest fire, temperature, humidity, windspeed and soil moisture are combined into a single figure, the Forest Fire Danger Index (FFDI).
As you might expect, this index has been steadily worsening over the past 40 years. The number of very high fire danger days in forest zones has been increasing by 1.6 days per decade.
So what does this mean for fire behaviour and spread?
In what we believe is a first, we have used 32 years of fire index data across Australia’s forest zones and compared the number of very high or severe fire danger days with areas subsequently burnt by fire.
We found a clear link, with a 300 to 500% increase in burnt area for every extra day of severe fire danger, and a 21% increase in burnt area for every extra day of very high fire danger.
Could fuel loads or prescribed burning be to blame? No. We looked for trends in these factors, and found nothing to explain the rise in burnt areas.
The main driver for the growing areas burnt by fire is Australia’s increasingly severe fire weather, accounting for 75% of the variation observed in the total annual area of forest fires. This is consistent with predictions from climate change scenarios that severe fire weather conditions will intensify due to increasing greenhouse gas emissions.
Other fire weather risks are also growing. We’re seeing more higher atmospheric conditions which can lead to the formation of fire-generated thunderstorms (known as pyrocumulonimbus clouds).
These thunderstorms emerging out of fire plumes can spread burning embers further and whip up more dangerous winds for unpredictable fire behaviour on the ground, as well as generate lightning in the fire plume that can ignite new fires far ahead of the fire front.
Dry lightning is the primary natural cause of fire ignitions. Here too, the trends are worsening in southeast Australia. We are now seeing 50% more dry lightning in forest areas in recent decades (2000–2016) compared to the previous two (1980–1999).
Under most climate change scenarios, fire weather is predicted to keep on worsening.
Can we predict our next megafire?
So could we have predicted how bad and how widespread the Black Summer fires would have been, if we had examined fire danger index forecasts in mid-2019?
In short, yes.
The huge amount of bush that burned is entirely consistent with the 34 days of very high forest fire danger across the forest zones that summer. That’s in line with the long-range bushfire weather forecasts provided to fire agencies earlier in 2019.
This means that in future years, we will be able to broadly predict the area likely to burn each fire season by examining fire index forecasts.
We can also safely – and sadly – predict that more and more of Australia will burn in years to come, with increasing numbers of megafire years.
While many factors contribute to catastrophic fire events, our Black Summer was not an aberration.
Rather, it was the continuation of fire trends beginning more than two decades ago. It is now clear that human-induced climate change is creating ever more dangerous conditions for fires in Australia.
We need to be ready for more Black Summers – and worse.