As notorious weather predictions go, the “barbecue summer” of 2009 is up there with Michael Fish’s dismissal of the incoming 1987 hurricane. The summer turned out to be wet and windy, and questions were subsequently raised as to whether reliable seasonal forecasts were worthwhile, or even possible.
Seasonal forecasts are constructed by integrating many complex numerical climate models, which encode the laws of physics as they apply to the climate system. Forecasts provide estimates of seasonal averages of weather conditions, typically up to three months ahead, and so provide an idea of how likely a forthcoming season will be wetter, drier, warmer, or colder than normal.
These forecasts have to be considered probabilistic, rather than deterministic. The chaotic nature of the climate system, with its strong sensitivity to initial conditions (also known as the “butterfly effect”) makes accurate long-term deterministic forecasts impossible. And inevitably, the approximate nature of all weather and climate models introduces a degree of inaccuracy. For example, the microphysical processes that occur in the formation of clouds at micrometre scales cannot be directly described by our climate models, which are typically constructed of millions of grid boxes, or nodes, of approximately 100km length.
Useful or useless?
Seasonal forecasts are increasingly used for forward planning purposes, such as by the government, emergency agencies, the water industry, and agriculture. Information about seasonal average rainfall and temperature for the growing season can inform a farmer’s decision about which type of crop to plant ahead of time, for example.
But this information is only useful if it is reliable, and it is impossible to generate an idea of reliability from a single probabilistic forecast. So the Met Office’s forecast of a barbecue summer for 2009 cannot really be said to have been “right” or “wrong” by itself. And after all, the Met’s Chief Metereologist Ewen McCallum did predict a 20% chance of a washout alongside a 50% chance of above-average temperatures – hence “odds on” for sun.
However, the reliability of a series of probabilistic forecasts can be quantified in a meaningful way. For example, examining a set of predictions over 30 years or so, if the forecasting system is reliable then the predictions will broadly match the facts. Predictions of a warm season with an 80% forecast probability of high temperatures will have been correct 80% of the time (and wrong 20% of the time). If a forecasting system is unreliable in this sense, then people can be misled – perhaps into making unfortunate barbecue-related decisions.
Rate my forecast
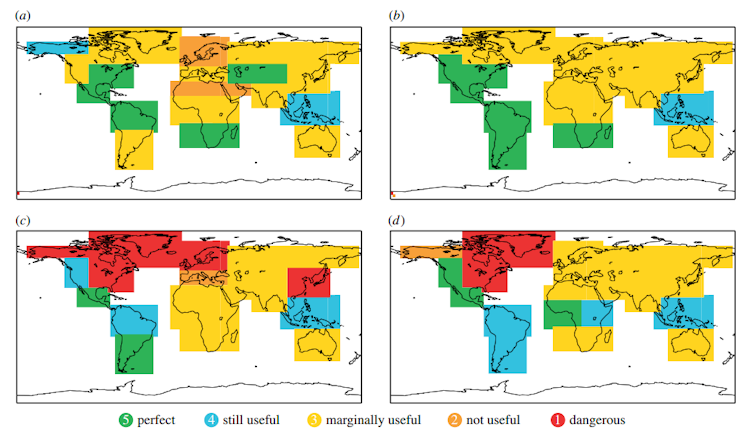
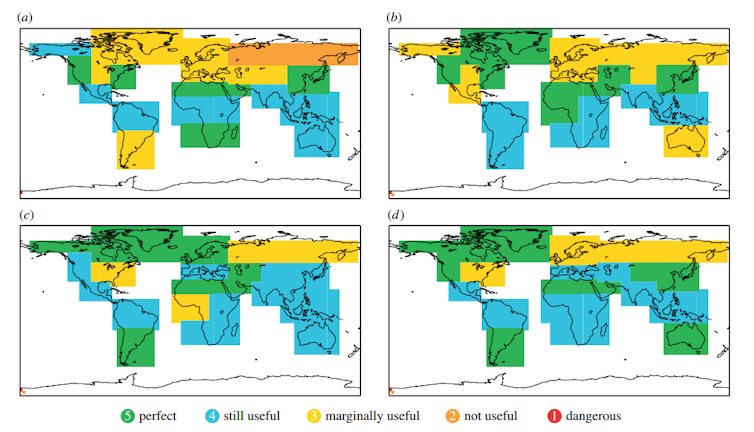
In our paper published in the Journal of the Royal Society Interface we developed objective criteria for classifying weather forecast reliability, from perfect reliability (5) and useful reliability (4), through a marginally useful category (3), to those defined as not useful (2) or even dangerously useless (1).
We used seasonal forecasts from one of the world leading centres in weather and seasonal forecasts, the European Centre for Medium-Range Weather Forecasts (ECMWF) based in Reading, to estimate the degree of reliability of temperature and precipitation forecasts during summer and winter for all land regions around the world.
Our proposed classification is based on the reliability curve in a so-called reliability diagram. The reliability curve describes the statistical relationship between the forecast probabilities and the statistical frequency with which these events actually happened.
If the curve (within some margin of error) indicates a perfect relationship between the forecasts and observations, we classify these forecasts as 5. In contrast, a flat reliability curve, demonstrating little correlation between forecast probabilities and observations, means that the forecasts are irrelevant for the seasonal climate conditions and we classify these cases as 2.

So how good are seasonal forecasts these days? There is no simple answer – they fall into a wide range of reliability rankings, depending on the region, the season, and whether we look at temperature or rainfall forecasts. Many fall into the perfect reliability category 5 for temperature, for example mild winters in Australia and Southern South America, warm summers over parts of North America, while summer forecasts of rainfall over Northern Europe including in Britain perform extremely badly. In fact, for this region we found that the more likely a dry summer appears in the forecasts, the less likely it is to come to pass in the real world.

The fact is we still have some way to go before we can provide reliable seasonal weather forecasts. The key to improving reliability in the future will be our ability to understand and represent physical processes more accurately. One way to improve the forecasts is to run the models at finer resolution, thus allowing the most important cloud systems to be represented explicitly in the models. But this will require much more powerful supercomputers than are currently available.
Another approach is to represent the uncertainties inherent within the model within the model’s equations themselves. This can be done by incorporating random processes within the model equations. While it may seem paradoxical that adding random noise to a climate model can actually lead to more accurate and reliable forecasts, increasingly this is what our research is telling us.

