


Contributions to the rate of global sea-level rise increased by about half between 1993 and 2014, with much of the increase due to an increased contribution from Greenland’s ice, according to our new research.
Our study, published in Nature Climate Change, shows that the sum of contributions increased from 2.2mm per year to 3.3mm per year. This is consistent with, although a little larger than, the observed increase in the rate of rise estimated from satellite observations.
Globally, the rate of sea-level rise has been increasing since the 19th century. As a result, the rate during the 20th century was significantly greater than during previous millennia. The rate of rise over the past two decades has been larger still.
The rate is projected to increase still further during the 21st century unless human greenhouse emissions can be significantly curbed.
However, since 1993, when high-quality satellite data collection started, most previous studies have not reported an increase in the rate of rise, despite many results pointing towards growing contributions to sea level from the ice sheets of Greenland and Antarctica. Our research was partly aimed at explaining how these apparently contradictory results fit together.
Changes in the rate of rise
In 2015, we completed a careful comparison of satellite and coastal measurements of sea level. This revealed a small but significant bias in the first decade of the satellite record which, after its removal, resulted in a slightly lower estimate of sea-level rise at the start of the satellite record. Correcting for this bias partially resolved the apparent contradiction.
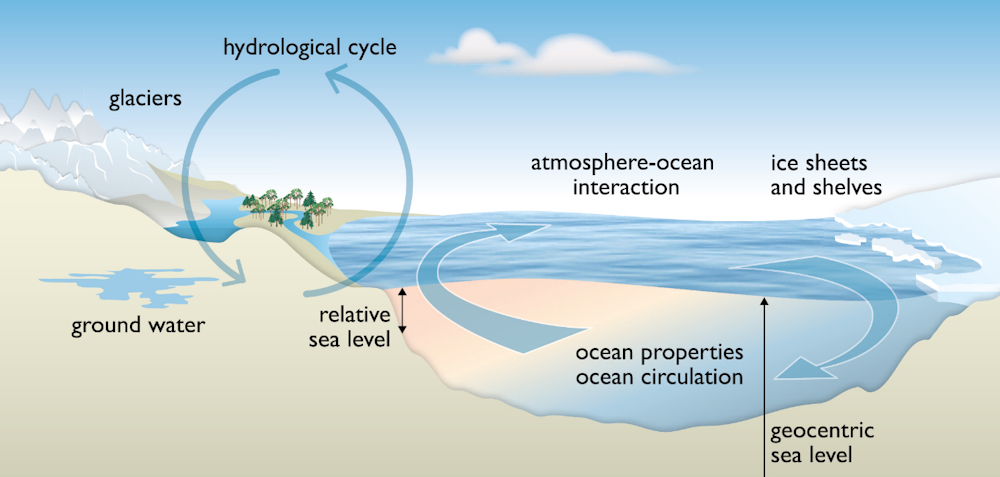
In our new research, we compared the satellite data from 1993 to 2014 with what we know has been contributing to sea level over the same period. These contributions come from ocean expansion due to ocean warming, the net loss of land-based ice from glaciers and ice sheets, and changes in the amount of water stored on land.
Previously, after around 2003, the agreement between the sum of the observed contributions and measured sea level was very good. Before that, however, the budget didn’t quite balance.
Using the satellite data corrected for the small biases identified in our earlier study, we found agreement with the sum of contributions over the entire time from 1993 to 2014. Both show an increase in the rate of sea-level rise over this period.
After accounting for year-to-year fluctuations caused by phenomena such as El Niño, our corrected satellite record indicates an increase in the rate of rise, from 2.4mm per year in 1993 to 2.9mm per year in 2014. If we used different estimates for vertical land motion to estimate the biases in the satellite record, the rates were about 0.4mm per year larger, changing from 2.8mm per year to 3.2mm per year over the same period.
Is the whole the same as the sum of the parts?
Our results show that the largest contribution to sea-level rise – about 1mm per year – comes from the ocean expanding as it warms. This rate of increase stayed fairly constant over the time period.
The second-largest contribution was from mountain glaciers, and increased slightly from 0.6mm per year to 0.9mm per year from 1993 to 2014. Similarly, the contribution from the Antarctic ice sheet increased slightly, from 0.2mm per year to 0.3mm per year.
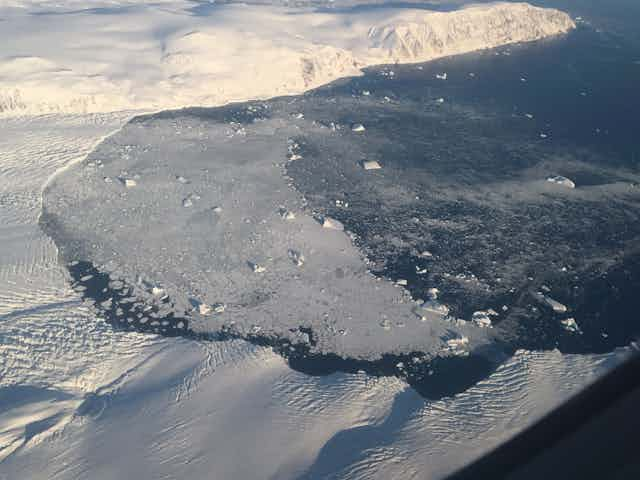
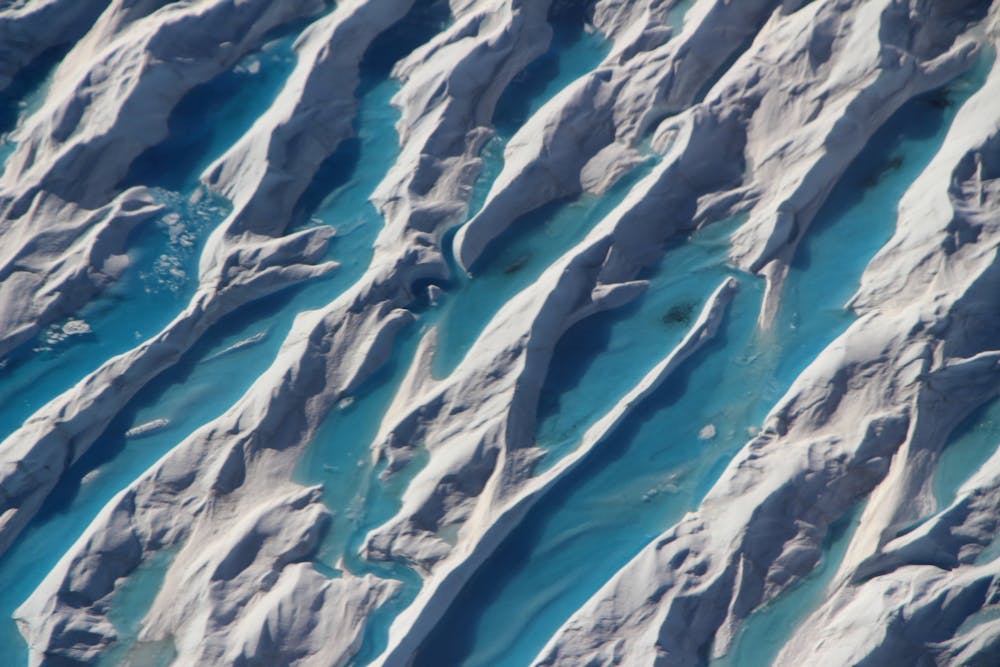
Strikingly, the largest increase came from the Greenland ice sheet, as a result of both increased surface melting and increased flow of ice into the ocean. Greenland’s contribution increased from about 0.1mm per year (about 5% of the total rise in 1993) to 0.85mm per year (about 25% in 2014).
The contribution from land water also increased, from 0.1mm per year to 0.25mm per year. The amount of water stored on land varies a lot from year to year, because of changes in rainfall and drought patterns, for instance. Despite this, rates of groundwater depletion grew whereas storage of water in reservoirs was relatively steady, with the net effect being an increase between 1993 and 2014.
So in terms of the overall picture, while the rate of ocean thermal expansion has remained steady since 1993, the contributions from glaciers and ice sheets have increased markedly, from about half of the total rise in 1993 to about 70% of the rise in 2014. This is primarily due to Greenland’s increasing contribution.
What is the future of sea level?
The satellite record of sea level still spans only a few decades, and ongoing observations will be needed to understand the longer-term significance of our results. Our results also highlight the importance of the continued international effort to better understand and correct for the small biases we identified in the satellite data in our earlier study.
Nevertheless, the satellite data are now consistent with the historical observations and also with projected increases in the rate of sea-level rise.
Ocean heat content fell following the 1991 volcanic eruption of Mount Pinatubo. The subsequent recovery (over about two decades) probably resulted in a rate of ocean thermal expansion larger than from greenhouse gases alone. Thus the underlying acceleration of thermal expansion from human-induced warming may emerge over the next decade or so. And there are potentially even larger future contributions from the ice sheets of Greenland and Antarctica.
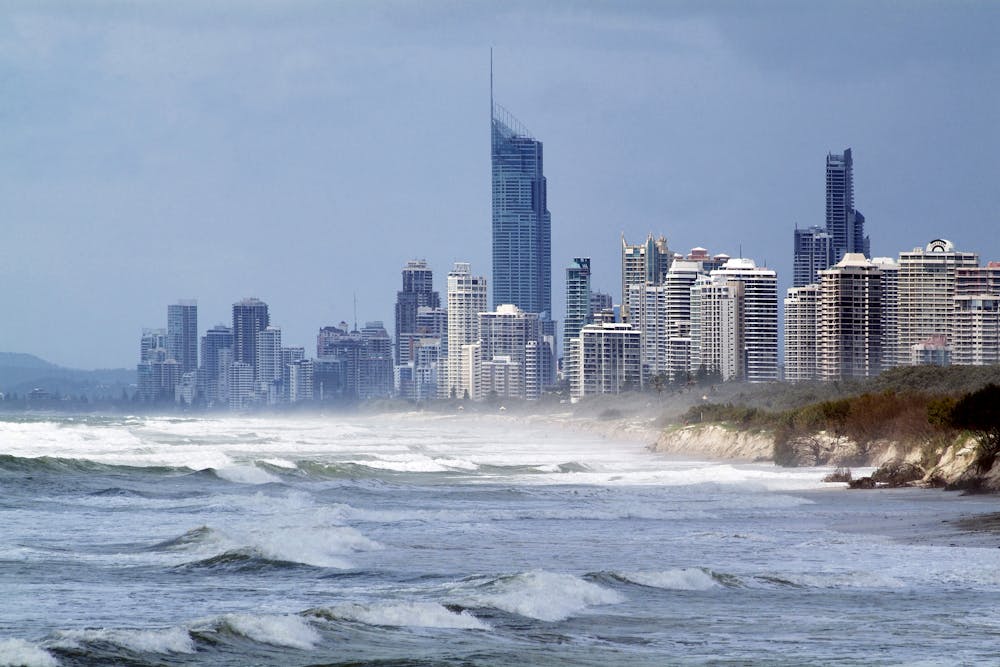
The acceleration of sea level, now measured with greater accuracy, highlights the importance and urgency of cutting greenhouse gas emissions and formulating coastal adaptation plans. Given the increased contributions from ice sheets, and the implications for future sea-level rise, our coastal cities need to prepare for rising sea levels.