

Exactly 30 years ago, I was pondering a graph of primate group sizes plotted against the size of their brains: the larger the brain, the larger the group size. I was curious to know what group size this relationship might predict for humans.
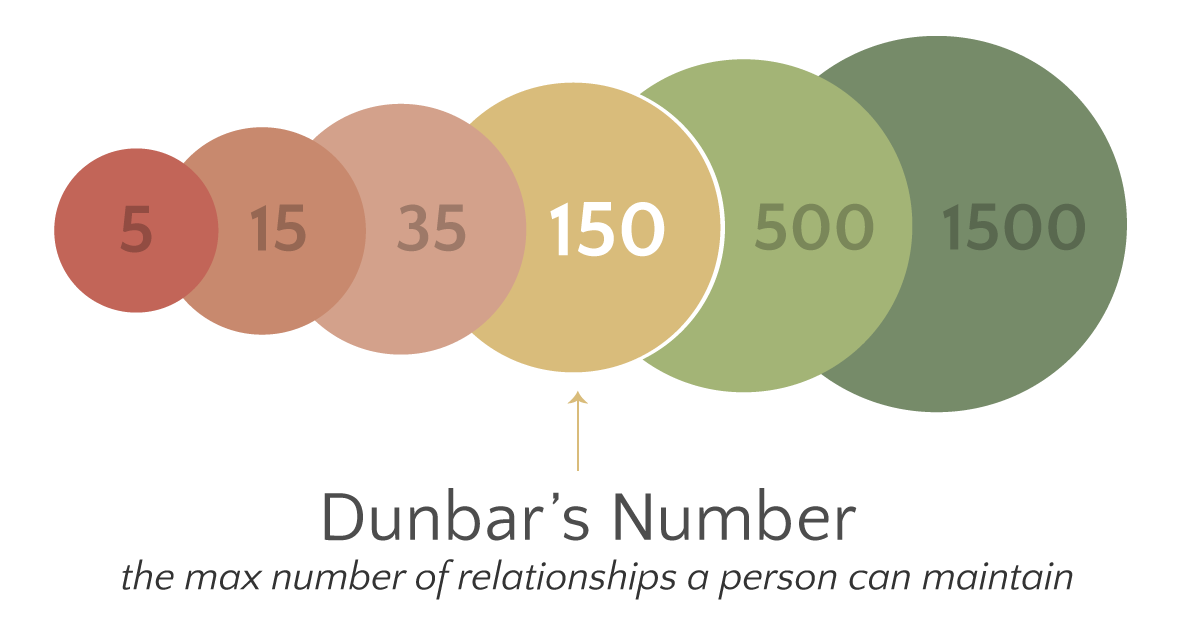
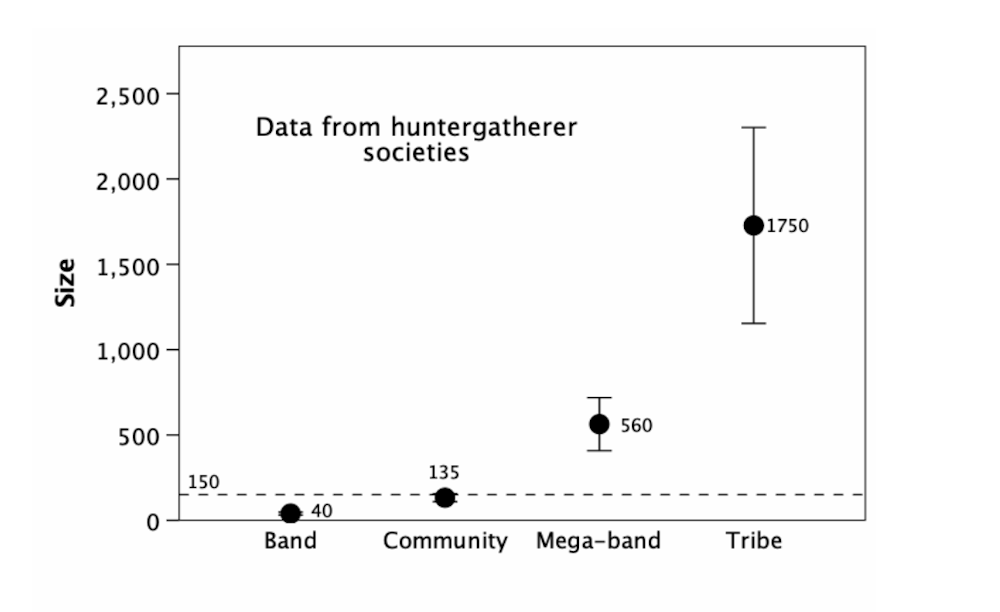
The number my calculations gave was 150. Since this seemed low, I hurried off to the library to look for data on natural human group sizes. Hunter-gatherers live in multilevel societies, with groupings of individuals forming a hierarchically layered structure – families within bands, bands within communities, communities within tribes.
The community level of organisation turned out to be almost exactly 150. Thus was born the “social brain hypothesis” and “Dunbar’s number”, the former referring to the relationship between group size and brain size in primates and the latter referring to the natural group size of about 150 for humans.
Dunbar’s number has attracted a great deal of attention over the years. For example, it has been used in the design of social media platforms, as well as being the basis of “secret handshake” online security algorithms and bot-detection software.
Architects have mulled over its application to building design, and there has been considerable interest in the world of business, for whom it resonates strongly. “Dunbar_number” yields nearly 1,400 papers on Google Scholar, and 26,500,000 hits on Google.
Challenging Dunbar’s number
This exposure has, perhaps inevitably, led researchers to challenge Dunbar’s number. In science, challenges are helpful: they force us to evaluate the assumptions underlying a hypothesis and, as a result, invariably point the way to new discoveries. This hasn’t always been true for Dunbar’s number: most of the critiques have just muddied the waters.
Despite the growing evidence, the same critiques reappear with suspiciously religious zeal. The most common claim is that human behaviour is culturally determined and so cannot be subject to the same biological rules as primate behaviour. Another variant on this claim is that networking platforms such as LinkedIn have made it possible for us to maintain more extensive social networks.
Most of these claims fail to recognise that Dunbar’s number applies to quality relationships, not to acquaintances – which account for the more casual outer layers of our social networks, beyond our 150 meaningful friendships.

However, a more recent challenge by researchers at Stockholm University claims to have finally debunked Dunbar’s number by showing that the social brain equation underpredicts human social group sizes. Alas, the study used flawed statistical methods and fails to account for the body of evidence we now have to support Dunbar’s number.
Read more: Why we dispute 'Dunbar's number' – the claim humans can only maintain 150 friendships
Developing Dunbar’s number
The evidence that personal social networks and natural communities approximate 150 in size, characterised by a very distinctive layered structure, has grown considerably in the past decade. We see it in telephone calling networks, Facebook groups, Christmas card lists, military fighting units and online gaming environments. The number holds for church congregations, Anglo-Saxon villages as listed in the Domesday Book and Bronze Age communities associated with stone circles.
This layered structure turns up in both communities and personal social networks, with each layer being around three times the size of the layer immediately inside it. In fact, the same layers, with the same sizes, turn up in the multi-level societies of monkeys, apes, dolphins and elephants. It’s just that humans have more layers.
Evidence from neuroscience
We’ve also filled in many of the behavioural and neurocognitive details that underlie the social brain hypothesis. More than a dozen neuroimaging studies have shown that, in both humans and monkeys, the size of an individual’s social network correlates with the size of their default mode neural network – the large brain circuit that manages social relationships.
Similarly, the touch-based bonding mechanism that holds these groups together – a mechanism that exploits the brain’s endorphin system – is common to both humans and primates. This is why hugging and physical touch is so important in our relationships.
Read more: #HugaBrit: the science of hugs and why they (mostly) feel so good
How not to do statistics
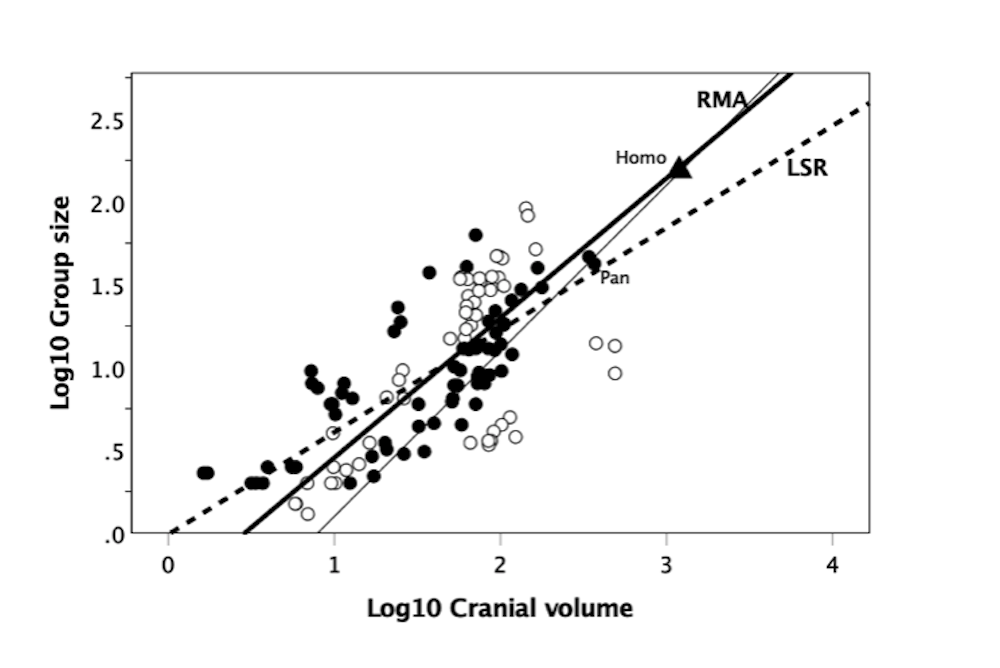
The real problem with the Stockholm study is that it makes an elementary statistical error of the “Statistics 101” variety – one that I had even cautioned against in my original 1992 paper. They use a statistical technique called regression analysis to calculate the relationship between group size and brain size. So far so good – we all do that. But regression analysis comes in different forms.
The Stockholm study uses the most common form – “least squares regression” or LSR. This was designed for used in experiments where we can specify the values on the X-axis (brain size in our case) precisely. LSR radically underestimates the true slope when this isn’t the case, delivering misleading results.
In addition, we now know that the social brain relationship actually consists of four grades. This also causes LSR to underestimate the slope, thus compounding the problem.
“Reduced major axis regression”, or RMA, is specifically recommended in these cases, especially when we want to make predictions. Better still, we should apply the equation for the right grade, or we could be off by a very long way.
The contrast is reflected in the size of group these two methods predict for humans. For the same dataset, the LSR method used by the Stockholm study predicts 71 (the basis of their claim), whereas the RMA method I originally used predicts 158.
Their second problem stems from a surprisingly impoverished understanding of primate and human social behaviour. Had they taken the trouble to read what we have spent the past decade publishing, as summarised in my recent book, the authors would have saved themselves a lot of unnecessary embarrassment.