

If you keep track of key measures of disability equality in the UK, you’ll know that the gap in employment rates between disabled and non-disabled working-age people has gone down over the past fifteen years.
Many experts have flagged this trend: Dame Carol Black in her influential 2008 review of health and work, DWP indicators 2009-2015 and a recent editorial in the British Medical Journal. It is on the basis of this trend that the UK appears to be more successful than its neighbours in OECD comparisons in integrating disabled people into the workplace.
But another look at the evidence puts this into question.
Amidst these reports that find a decrease in the disability employment gap, another group of researchers – including authors of two papers in the BMJ and a report by leading expert Richard Berthoud – have written about how it is going up. Partly this is explained by a difference in time period (starting from 1998 compared to the late 1970s). But, even focusing on the same period (1998-2012), this latter group find no change in the disability employment gap.
Without explanation or reconciliation (or even a dialogue between the two groups), the most basic question in disability-employment research: “has the disability employment gap gone down?” cannot be answered. This was the subject of recent research I conducted with my colleagues Ben Baumberg and Melanie Jones. Resolving the issue is crucially important if we are to judge the effects of equality legislation and the government’s Work Programme, which seeks to get the long-term unemployed back into work. And also to judge the 2015 Conservative Party Manifesto commitment “to halve the disability employment gap”.
Different surveys
The difference in trends arises from choice of survey. Those who find that disabled people are catching up in terms of their employment rate have used the Labour Force Survey, while those who find no change have used the General Household Survey. Importantly both surveys are collected and published by the UK government, are based on a random sample of households and measure disability in the same way, namely as a longstanding illness or disability that limits daily activities.
There are lots of differences between surveys which could give rise to differences in disability employment gaps – though not perhaps differences in trends in those gaps. These include differences in the methods used to interview people (such as telephone or face-to-face), differences in question wording and differences in areas of the country included.
Looking into all of these details and harmonising the data by restricting our analysis to only those parts of the surveys that are strictly comparable, we compared standardised employment gaps across the different surveys. We also included results from a third high-quality survey that no-one had previously used in this context, the Health Survey for England.
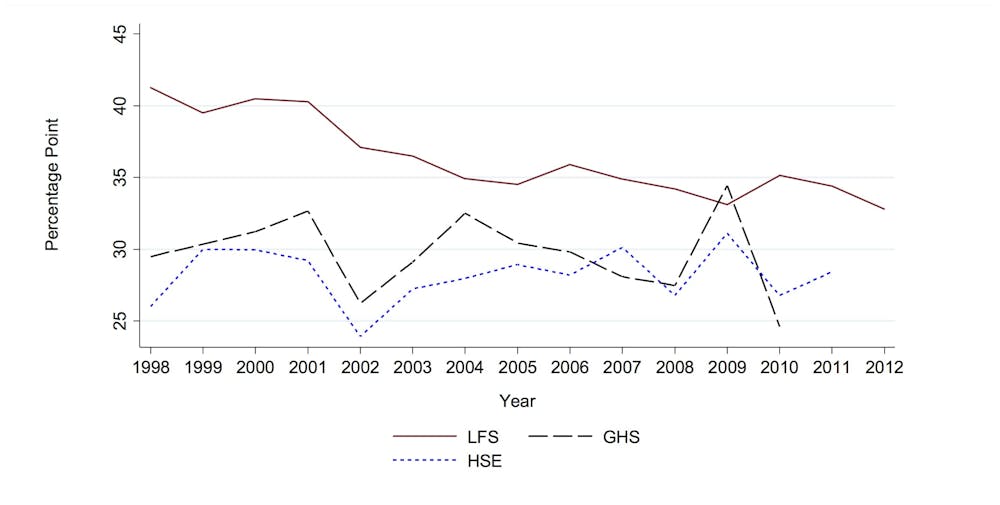
The trends for all three surveys show that the same puzzling differences in trends remain after harmonisation. The Labour Force Survey (LFS) shows an improving trend towards greater equality in employment. But this trend is not evident in the Health Survey for England (HSE) or the General Household Survey (GHS). You can see this in the figure below:
Explaining the difference
One potentially important difference in the LFS is that the proportion of working-age people reporting disability has been rising steadily and there is a strong association between the level of disability reporting and the disability employment rate in the LFS. This makes sense – the people who move across the borderline between reporting and not reporting a disability are likely to be less severely disabled than people who will definitely report a disability.
In contrast, in the HSE and GHS, disability reporting has been relatively stable – if anything it’s been falling over time – and it is not strongly linked to the employment rate. Until we understand why disability has increased in the LFS (but not in the other surveys), we cannot conclude that employment prospects for disabled people have improved.
In the meantime, however, the LFS measure is the main policy-evaluation tool used by the government in formulating its policies towards the employment of disabled people. This is unsatisfactory. Since the LFS trend is inconsistent with trends in the others, it should not be relied upon as the sole indicator of the disability employment gap in the UK. Until we can explain this contradictory evidence, governments should stop claiming success in the integration of disabled people into the workplace.