

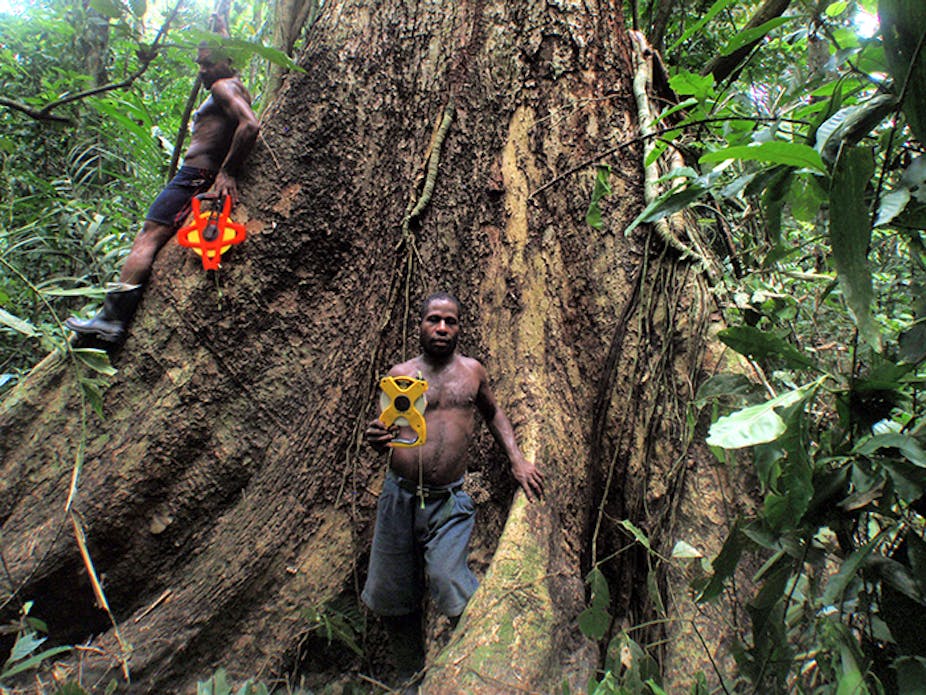
While hugging a tree sounds relaxing, it’s harder than you might think - especially when the tree is 20 storeys high and 3 metres wide, it’s hot as hell, and you’re swatting away swarms of sweat bugs.
But there’s a hard-headed reason behind that tree-hugging work: you can’t properly manage what you don’t measure.
Lack of reliable information about so much of the world’s forests is part of why we’re still losing forests so fast. Deforestation contributes an estimated 10-15% of all human-caused greenhouse gas emissions. Forests and the clouds of water vapour that they produce also help to cool the planet.
But without an army of scientists, how can we do a better job of counting the trees and carbon in our forests? We decided it was time to test if the locals could put scientists out of a job - and it turned out we weren’t alone.
Why bother counting tree carbon?
Half of a tree’s dry weight is made up of carbon. Using simple field measurements, such as girth measured at 1.3 metres above the ground, is the surest way without cutting the tree down to estimate its weight and its value in locked-up carbon.
It’s labour-intensive work for scientists like us in muddy boots, measuring hundreds of trees in each hectare, usually in remote, logistically challenging terrain. And all of that makes it an expensive process, and therefore hard to do on the scale we need to properly account for the carbon value of our forests.
Fortunately, we’re also getting better all the time at measuring forests from space using satellites. Only last week, a team of US researchers (including from Google) published the first high-resolution global map of the world’s forests, which revealed that we are continuing to cut down forests around the world much faster than we’re regrowing them.
Published in the journal Science, the map is made up of more than 650,000 satellite images, making it possible to search for particular locations and then zoom in down to a 30-metre resolution to see where forests have been lost (shown in red) or gained (shown in blue).
But for the most reliable results, counting trees and the carbon stored in them requires old-fashioned sweat and techniques used for a century.
Growing money from trees
One of the ways that it’s possible to make money by leaving forests standing is through the United Nations’ Reducing Emissions from Deforestation and forest Degradation program REDD+, which aims to reduce forest carbon emissions in developing countries by paying to preserve to the carbon stored in these forests.
But that’s easier said than done. When REDD+ was first framed in 2007, it was heralded as “the most promising opportunity for reducing deforestation, conserving forests and contributing to climate change mitigation”. Now, enthusiasm for the policy has dwindled.
The UN program has largely stalled due to stringent Monitoring, Reporting and Verification requirements, that are beyond the capacity of most developing countries.
Unfortunately less than 10% of the 99 developing countries eligible to be part of the REDD+ scheme have the in-house expertise or the resources to employ outside experts to conduct such field inventories. As a result they cannot reap the economic benefits of protecting forests.
The idea of bridging this gap by engaging forest-dependent communities to monitor carbon in their own forests has become more popular. But can local people collect data reliably, matching the kind of results that scientists get to meet the stringent Monitoring, Reporting and Verification requirements?
Can locals beat scientists at their own game?
Our team of scientists spent seven months in the YUS Conservation Area on the Huon Peninsula of Papua New Guinea, a rugged, road-less mountain region where people depend on their forest for building material, food and fuel.
The participants in our study live in three of about 30 communities that have achieved a remarkable milestone for conservation.
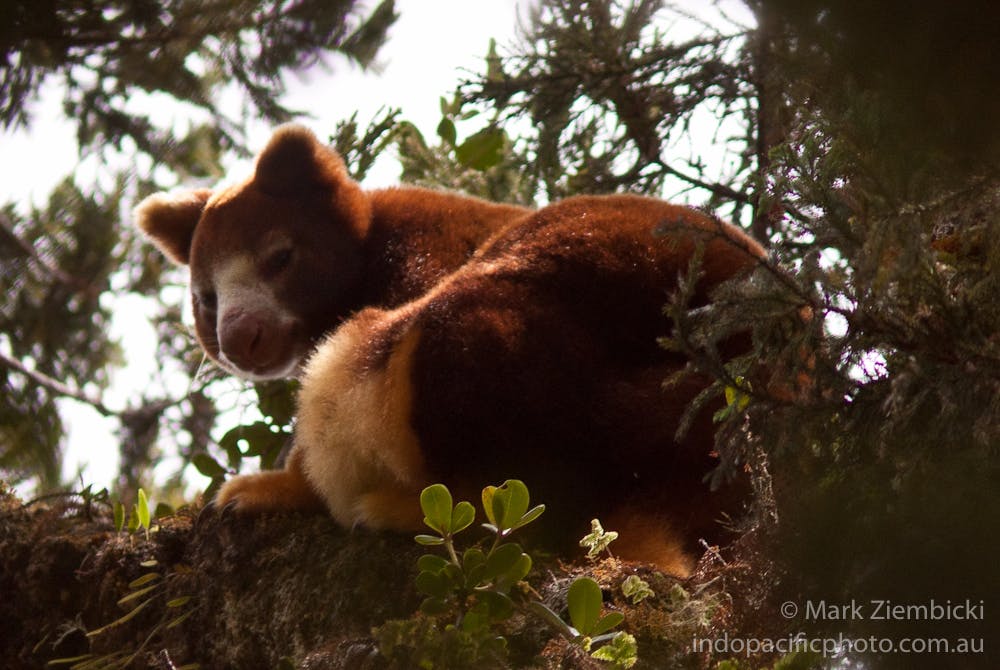
Collectively these PNG communities have pledged 74,000 hectares of primary forest to protect the endangered Matschie’s tree-kangaroo from overhunting.
In 2009, the YUS Conservation Area became the first (and only) area protected under the PNG’s Conservation Area Act 1978. Thus, not only can community-led forest monitoring provide local livelihoods in exchange for forest protection, it will help ensure the protection of endangered species into the future.
The 12,000 villagers in the YUS area currently have limited options for earning a wage. There is therefore a risk that they will resort to the old school livelihood options provided by extractive industries at the cost of inevitable environmental degradation and cultural dislocation.
We trained six member teams from three communities to perform forest-carbon assessments using survey tapes, GPS units and laser-rangefinders. None of this equipment had been previously encountered by the villagers.
These teams then undertook self-led forest-carbon surveys in 41 randomly selected survey plots. Once the community surveys were complete, we spent three months re-measuring the same plots. We double-checked all 4211 field measurements recorded by the community teams from lowland forest at 50m altitude to cloud forest at 3000m.
Our results confirm that, with only three days of training in unfamiliar and complex techniques, people with little formal education can produced real-world field data as reliably as experts.
And in some instances, communities performed better than scientists. For example, marking out a rectangular plot area is a difficult task in dense forest on steep terrain and plot area was more accurate in the community surveys. This may seem trivial, but errors in plot area are directly proportional to errors in final carbon estimates.
We further found that the biggest source of error in forest-carbon estimates is from imprecise measurement of large trees. Though trees of more than 50cm in diameter only constitute 14% of the trees measured, these trees were responsible for 85% of the total error in forest carbon estimates.
Community results with global significance
We’re currently preparing our findings from PNG to submit to a peer-reviewed journal. But our results have since been independently backed up by an international group led by Finn Danielsen, published in the latest edition of the journal Ecology and Society.
Their study - which was the first-ever quantitative study of REDD+ community participation - demonstrated that local people from Indonesia, China, Laos, and Vietnam using simple tools like sticks and ropes could generate forest-carbon data on par with professional foresters using high-tech devices.
The study also found that nearly half of REDD+ projects still don’t work with communities in gathering data on forests. So there is huge, untapped potential for local communities to earn money from protecting their forests, rather than that REDD+ funding ending up with outsiders.
As the latest UN climate talks in Warsaw come to a close, with little sign of major progress, this is at least a glimmer of hope.
For communities considering whether to forego cutting down their forests, locally-led forest monitoring offers a potential win-win-win for people, forests and our climate.