
What energy crisis?
Who could forget the energy “crises” that affected electricity supply across south-eastern Australia last year.
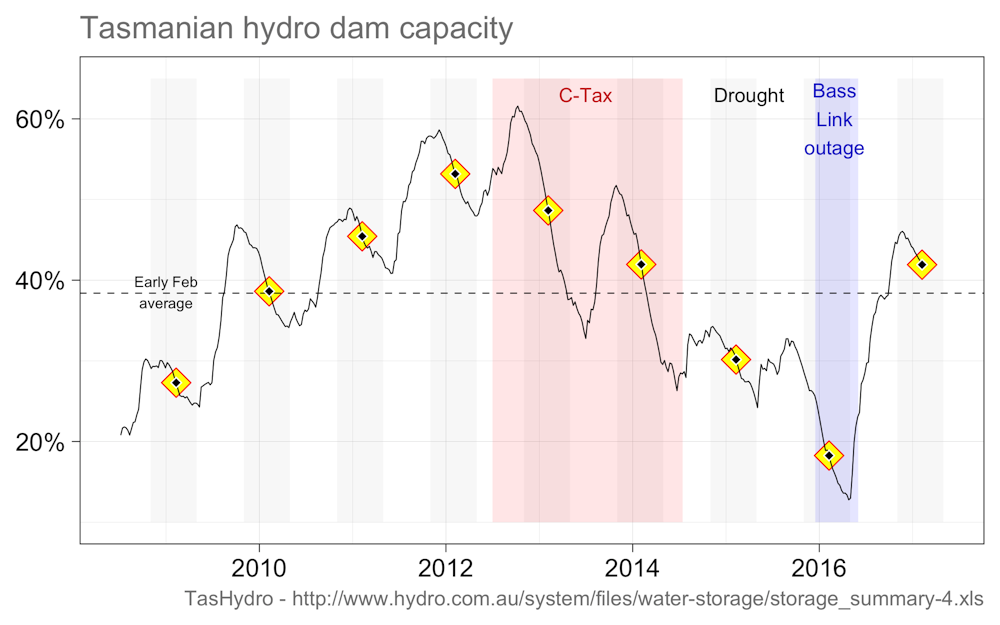
Firstly the Tasmanian crisis, following the Basslink outage in December 2015. With hydro storage dams at record lows following a drought on the back of aggressive storage withdrawals during the carbon tax years, Tasmania enforced drastic measures to ensure supply. Thankfully, flooding winter rains, together with the eventual restoration of Basslink in June helped resuscitate the apple isle’s energy supply. Tasmania’s hydro storages now stand at around 40% of full capacity, more than double at the same time last year.
July saw the first of the sequence of crises in South Australia that followed from, and were in many eyes attributable to, the closure of its last coal-fired power plant at Port Augusta in May of 2016.
With gas prices at record highs, and South Australia effectively isolated from Victoria due to upgrades on the main interconnector into Victoria, spot prices sky rocketed, culminating on a cold, windless winter day on July 7th. Energy consumers that had not contracted supply were at the whims of traders. Prices averaged over $1400/MWhour for the day and around $520/MWhour for the week, almost 800% above the average for that time of year.

All that was superseded by the events of September, when extreme winds played havoc with the South Australian transmission system, toppling transmission lines in the mid north. Poorly understood default control settings automatically disconnected wind farms, leading to the interconnector tripping and a state-wide black out. Unanticipated problems in restarting the system exacerbated the pain.
Finally, failure of a transmission line in south-west Victoria on December 1 lead to a power loss at the aluminium smelter in Portland. The damage to “frozen” pot lines has jeopardised the smelter’s ongoing viability. As the state’s largest energy consumer and the one of the biggest regional employers, the political fallout is intense.
After the NEM’s “annus horibilus”
With 2016 very much the National Electricity Market’s (NEM) “annus horibilus”, pundits awaited the summer of 2017 with bated breath. The combination of high gas prices, frighteningly intense summer heat, a fragile and ageing energy supply system, and increasing concerns about market rules, the scene was set for “interesting times”. Whatever was to transpire it was always going to be inflamed by political point-scoring - the one commodity that seems rarely in short supply.
And so it would prove to be, even in the northern states of Queensland and New South Wales that had hither-too largely escaped the wrath of Electryone.
The summer of 2017 has seen extraordinary rises in spot prices beset the NEM, particularly in New South Wales and Queensland. Further blackouts in South Australia, and market interventions to avert them in New South Wales, have done little to assuage concern if our electrical power system is fit for purpose. So far, 2017 Queensland spot prices have been around 400% above the historical average for this time of year.
With the summer far from finished, our politicians remain hard at it, pointing fingers and apportioning blame, doing almost anything and everything but that which is in most short supply - namely, embracing bipartisanship. A glimmer of hope is to be found in comments from Chief Scientist Alan Finkel, who has been charged to lead a review of the security of our National Electricity Market.
What is the NEM?
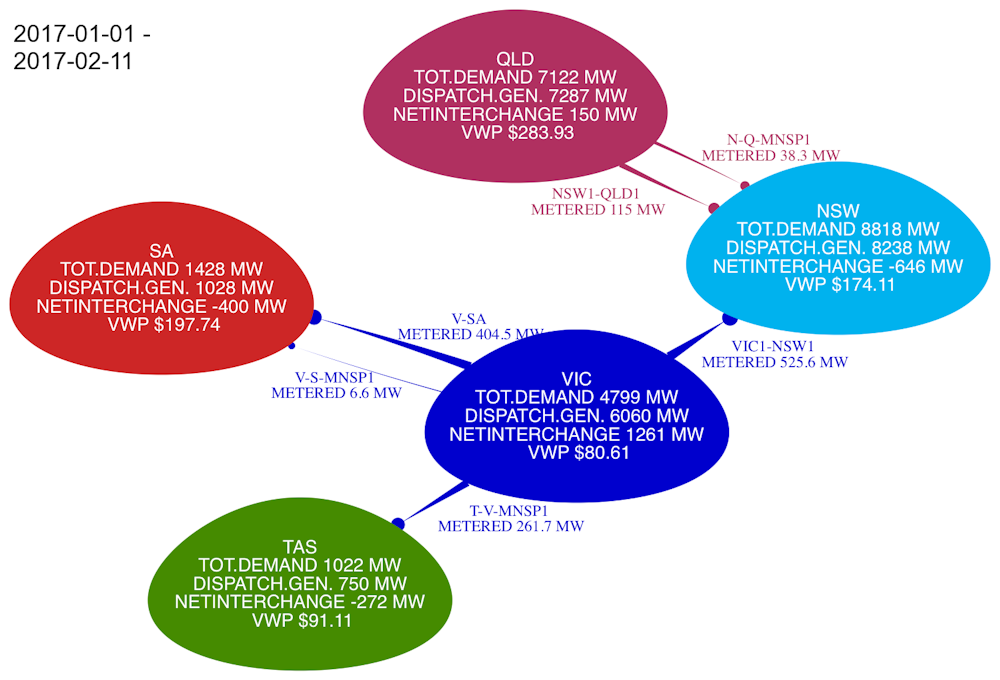
To provide some guide to what is happening to the NEM, and why, I have compiled a few pictures that illustrate elements its basic anatomy. This is designed as background. In following posts in this series I will focus on the details of recent events that have so heightened the political heat.
The NEM comprises five interconnected regional jurisdictions - one for each state along the eastern seaboard and South Australia. For each region, the market operator AEMO runs a 5-minute interval, energy-only, dispatch ‘pool’, or spot market. The objective is to balance supply with demand in a way that minimises cost, based on the bids submitted by generators. It is a complicated process. Settlement prices are aggregated at half hourly intervals, and determined as the average of bid prices of the last offer needed to meet the demand for the dispatch interval.
With the focus of the dispatch ‘pool’ being least cost electricity supply, AEMO also operates several ancillary markets to ensure the requirements for safe grid operation are met. This includes the provision of reserve supply and frequency control normally sourced from synchronous generators such as large coal plants.
AEMO also has regulatory powers to intervene in the market by demanding generation be made available in cases when the total bid capacity is insufficient. When demand exceeds total capacity, or if the available capacity cannot be made available in a timely fashion, AEMO can authorise load-shedding, effecting a re-balancing of demand to meet the available generation capacity.
Normally, large electricity consumers will contract power supply via the contract market, rather than directly through the spot market. This insures consumers against the potential for extreme price volatility allowed on the spot market, that can see prices range from between -$1000 and $14,000/MWhour. For comparison, the standard domestic retail tariff is about $250/MWhour or $0.25/kWhour.
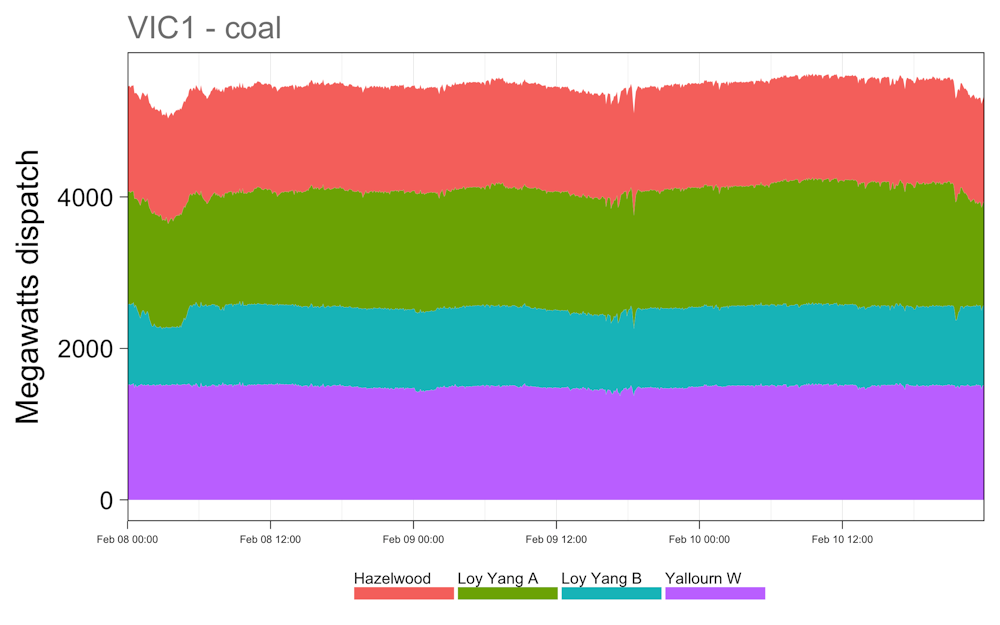
The bid strategies of power plants reflect differences in their cost structures and performance characteristics. For example, fuel costs for brown coal generators are very low, but they are best operated at constant load. In contrast gas plants are generally much more rampable, but much higher cost. In Victoria, as a consequence gas is used almost exclusively to meet peaks in demand as illustrated in the three graphics below.

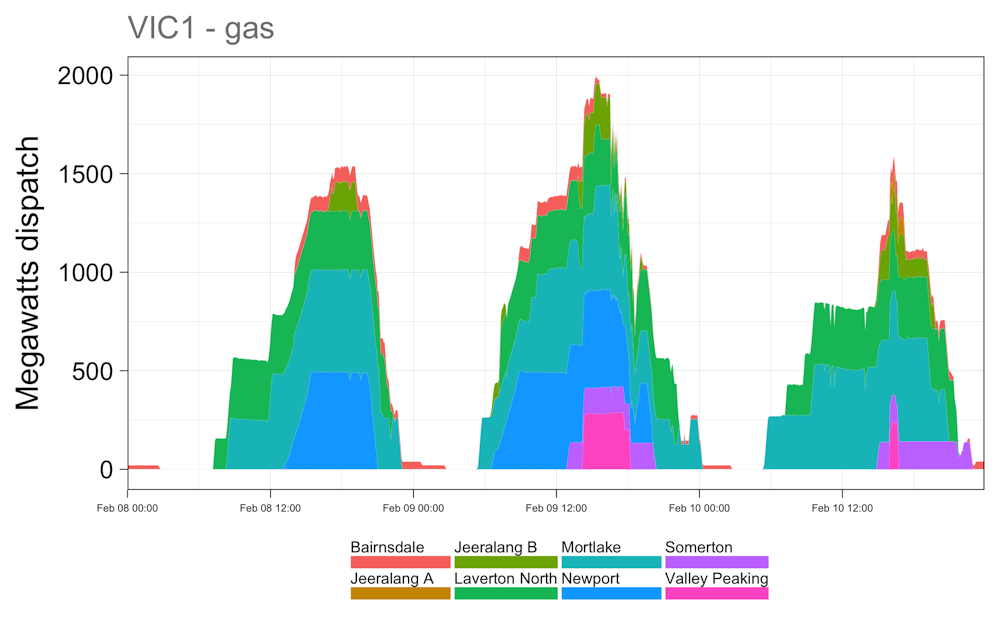
Typically a large base-load generator, such as a brown coal plant, will bid much of its capacity into the spot market at their short run cost, to ensure a slice of the action. In contrast peaking power plants will bid at price well above marginal cost, anticipating that they will required only very occasionally. Forward contracts of various kinds help insure revenue streams for base load generators against spot prices below their long-term cost of production, and for peaking plants being available when needed.
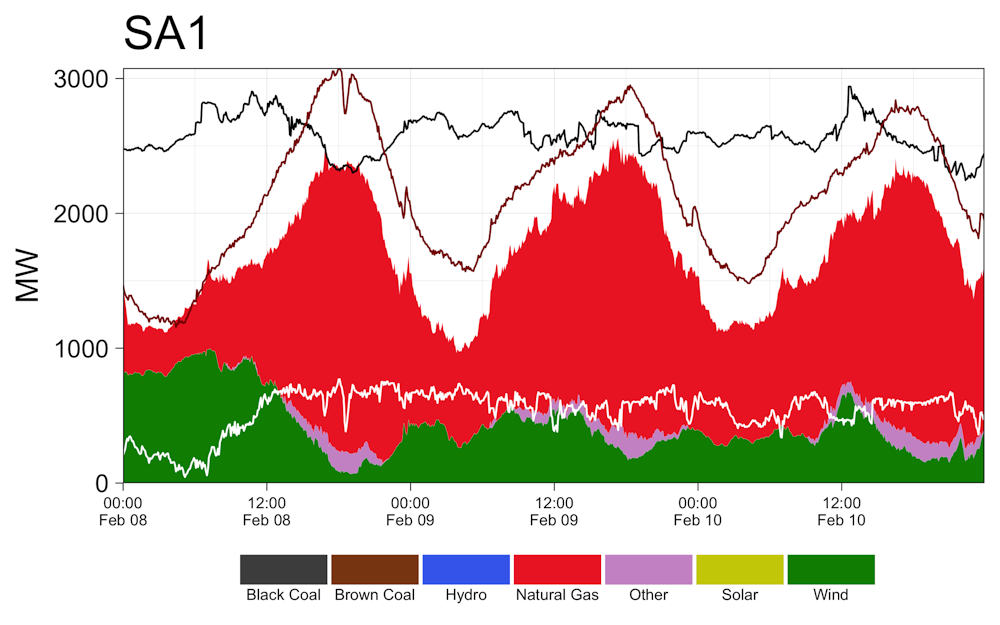
Renewables such as wind dispatch at the whims of the weather, and because of negligible short run marginal costs, bid their output at very low prices. As a price taker, wind generation tends to drive spot prices lower, impacting the viability of other generators. As shown below, and to be discussed in more detail in a following posts, the recent events in South Australian dispatch highlights the challenges in the market when wind power output correlates poorly with demand.
Finally, rooftop PV is not dispatched onto the grid, but rather is “revealed” to the market as a reduction in demand.
Why are spot prices rising?
In theory, the spot market is designed to encourage a competition that ensures prices provide generators with a revenue stream that is linked to their long run marginal cost of production. If prices do depart, competitive market principles should ensure system re-balancing either through investment in new generation or the withdrawal of old. Of course, competition needs to be provided by an adequate diversity in ownership.
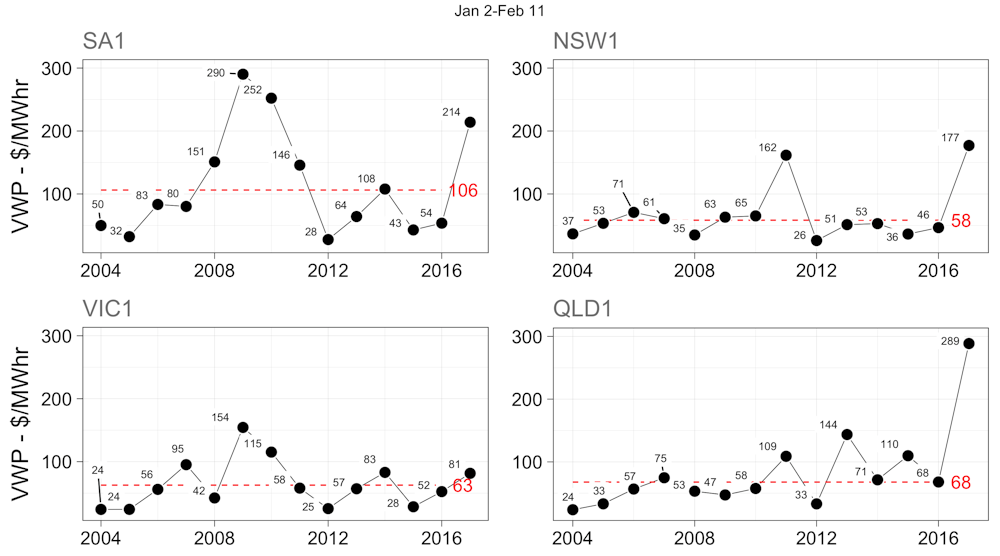
And so shifts in the spot prices, signalled via the contract markets, are designed to reflect the balance of demand and supply. The years 2009-2014 were characterised by persistent reductions in demand across the NEM, in part due to growing penetration of solar PV. At the same time, the addition of new wind farms to meet Renewable Energy Target contributed to a growing oversupply in the market, reflected in very subdued spot prices. For example from 2010-2014, Victorian spot prices averaged about $35/MWhour, after factoring out the carbon tax. While that price is above the cost of production for existing Victorian brown coal generators, it would be well nigh impossible to obtain financing for any new large scale generation at prices less than about 2-3 times that.
Since 2014, demand has risen in Queensland due in part to the commissioning of new LNG gas processing facilities at Curtis Island. Reductions in generation capacity in Victoria and South Australia due to closure and/or mothballing of several fossil plants (Anglesea in Victoria and Northern and Pelican Point in South Australia), has significantly tightened the supply-demand balance. Consequently, spot prices are on the rise across the NEM.
Why do spot prices vary between regions?
Spot prices averaged about $60/MWhour across last year, but vary somewhat by region and by season.
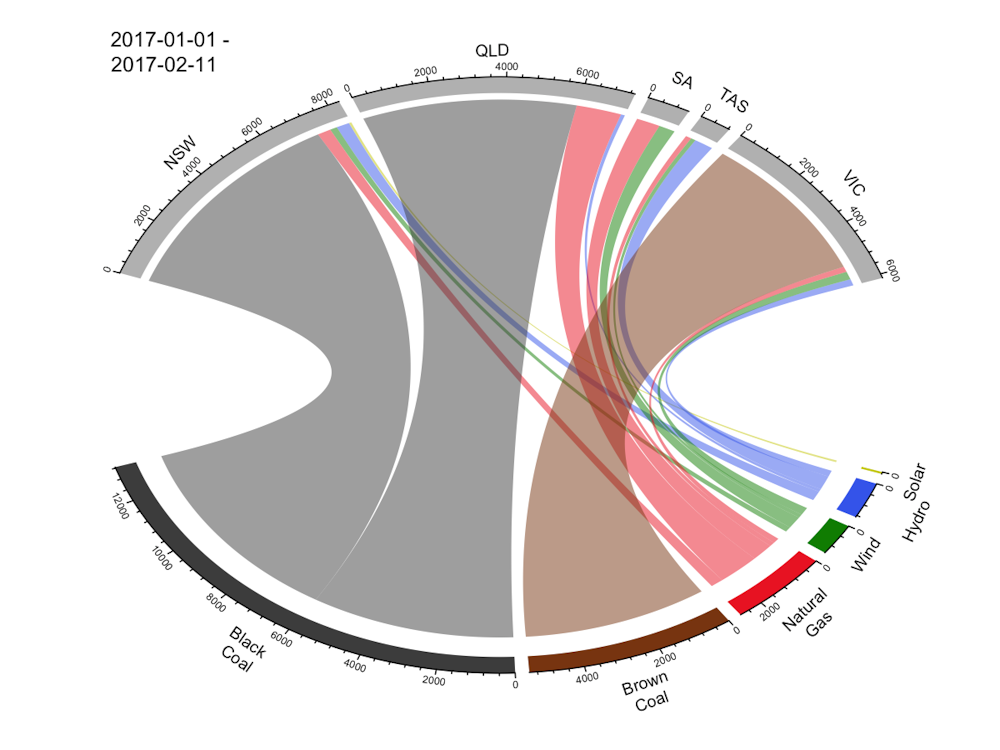
As shown in diagrams above the make-up of generation in each of the five regions varies considerably, leading to different cost structures. Similarly differences in demand profiles lead naturally to differences in generation fleet. Finally there are differences in market competition.
With limited interconnection capacity, along with differences in regional demand and generation portfolios, occasionally lead to large separation in spot market prices. In times of very high demand during summer heat waves and winter cold snaps, or in times when supply is constrained by infrastructure (power plant or transmission) outages or fuel supply/cost issues, spot prices can be extremely volatile.
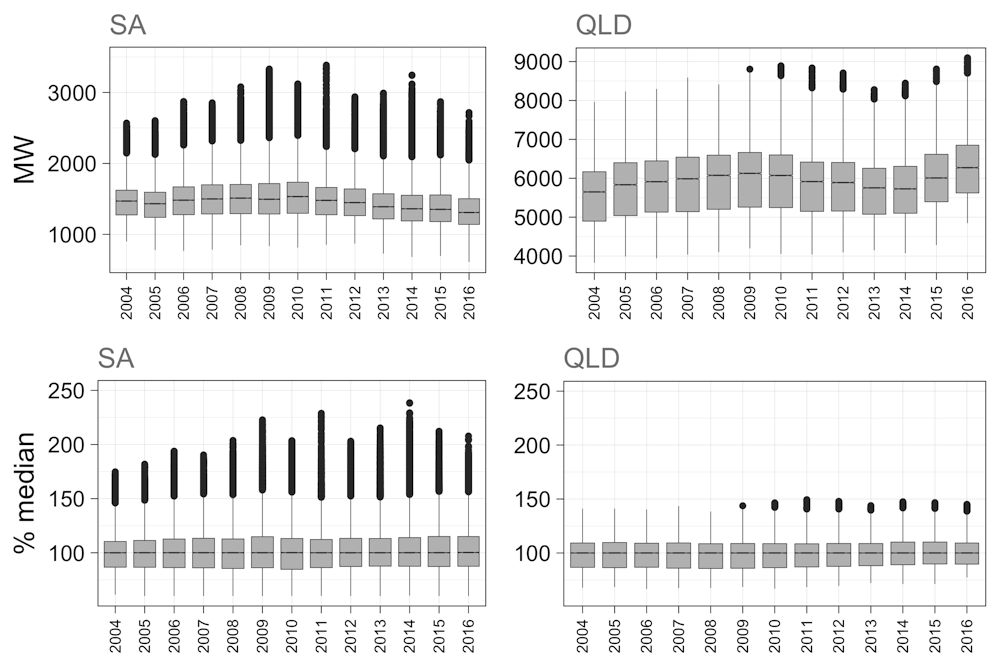
Historically, South Australia has had the highest prices and Victoria the lowest. This reflects the much higher proportion of gas in the generation mix, its larger proportional daily/seasonal cycle between minimum and maximum demand and, arguably, competition issues. As illustrated below, peak demand in South Australia is over 250% higher than the median, compared to around 150% in Queensland. A greater relative proportion of peaking generation capacity means higher average spot prices. Competition is a particular issue in South Australia, since the closure of the Northern Power Station, as it is in Queensland.
How well suited is our market?
It is important to realise that while the physical characteristics of any power system are governed by the laws of physics, the market itself is a construct - just one of many ways of matching supply and demand. In particular as an energy-only ‘pool’ , there are questions about how well our NEM is suited to meeting the need of providing a cost effective, secure and environmentally acceptable energy supply. In particular, there is very little incentive for demand side management. Moreover, the power system does not operate in isolation, and needs to be considered with other policy settings in the gas and water markets as well as climate policy. In the following posts in this series I intend to address some of these issues with examples drawn from our recent experience on the NEM.