Did you notice how windy it was here in Melbourne on the first weekend of October, when the city stopped for the annual festival of the boot - a.k.a. the AFL Grand Final.
Whether or not it influenced the result of the match, who knows. But the wind did do things to the electricity market, giving an insight into the emerging opportunities and challenges Victoria faces in dealing with what is one of the most egregious emissions profiles of any advanced economy.
Wind is at front and centre of the energy debate. As the cheapest of the current grid connected renewable generation sources, wind attracts more than its share of commentary. Sadly, much of that has been inspired more by ideology than by fact.
With the new atmospherics emanating from our changed national leadership, the winds of change seem to be blowing afresh. In that spirit, I thought it instructive to look at how wind impacted the market on that windy Saturday in early October.
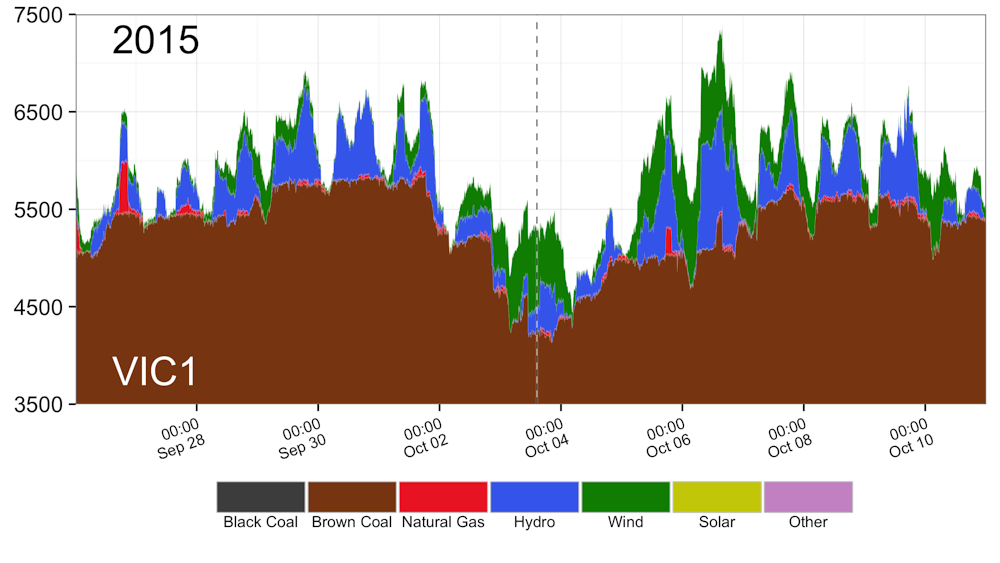
As the ball was bounced to initiate proceedings, Victorian wind farms were dispatching power onto the grid at a rate of about 820 megawatts. At the time, wind contributed about 15% of the total Victorian dispatch, with wind farms operating at close to 90% maximum output.
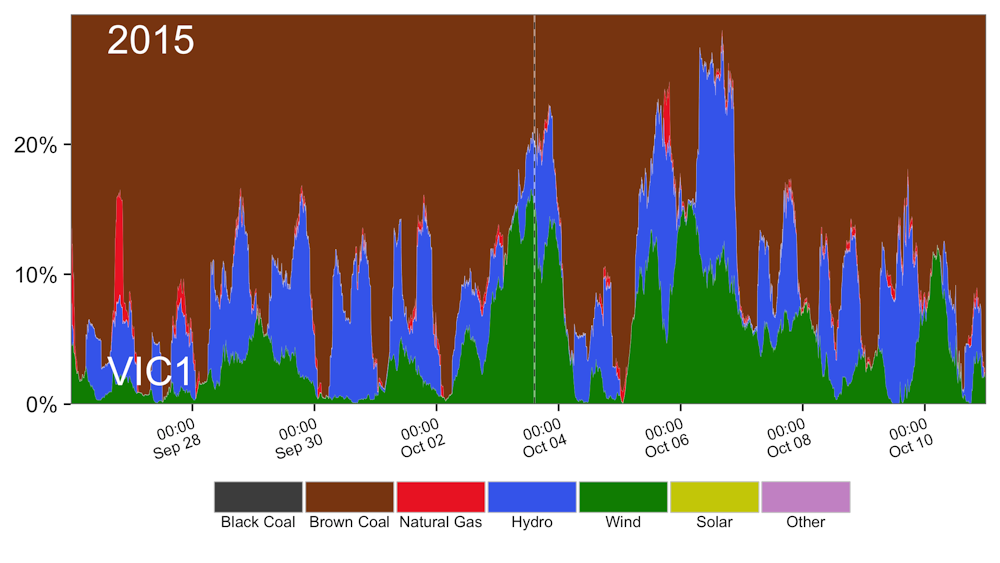
Grid-connected renewable generation (wind and hydro) accounted for about 20% of total dispatch at the time, at about twice the average for the 15 day period shown in the figures above. Before the celebrations had ended, sometime in the wee-hours of Sunday morning, wind generation had collapsed, and by late on Sunday evening, renewables were contributing less than 1% of Victorian generation.
If that sounds problematic, give a thought to the owners of gas generation plant, which dispatched at just 1% of full capacity over the 15-day period.
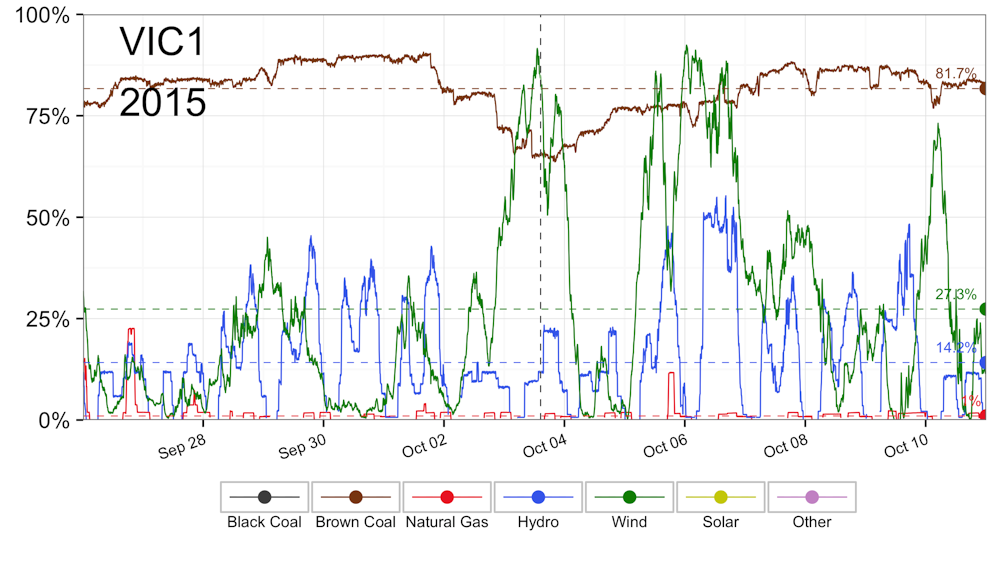
The high penetration of renewables on that early October Saturday afternoon reflects the combination of both high winds and low demand. Both combined to significantly suppress output from the brown coal generators, causing the CO2 generated to fall from over 8000 tonnes per hour just a few days earlier, to under 6000 tonnes per hour for the duration of the game.
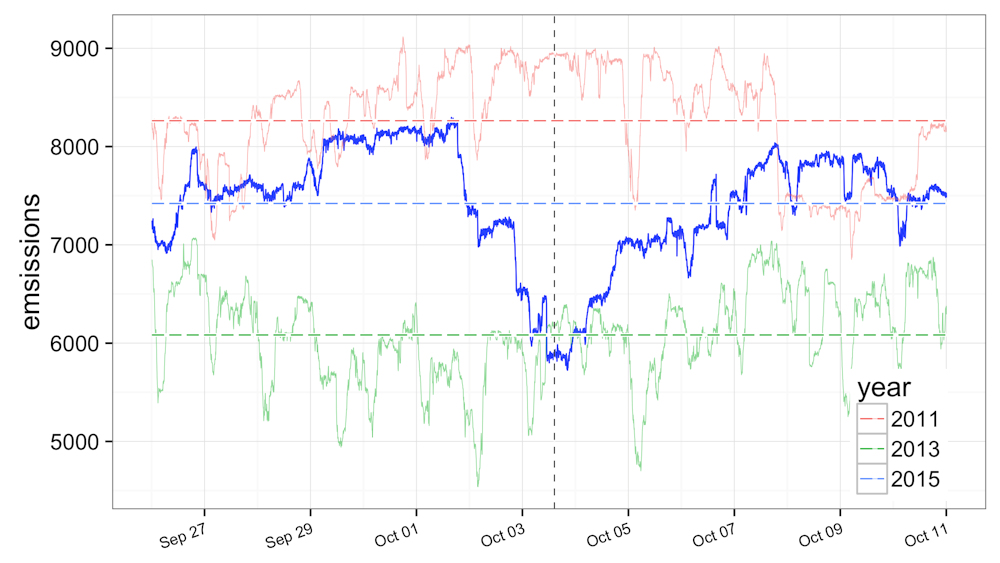
With the corresponding emissions intensity falling from 1.4 tonnes CO2 per megawatt hour down to 1.1 tonnes, should the AFL be claiming abatement credits?
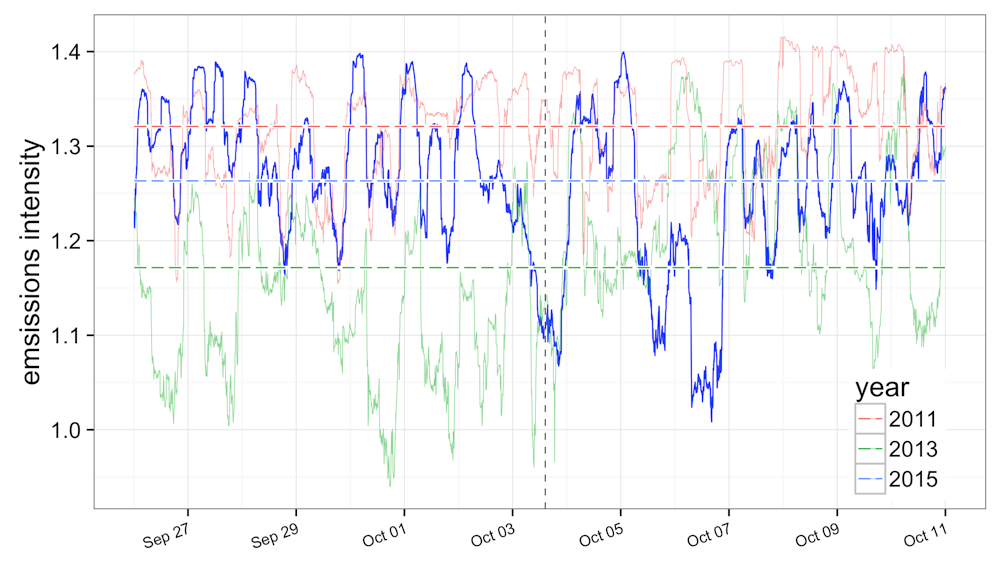
More seriously, comparison with equivalent periods in 2011 and 2013 gives an idea just how much Victorian emissions have - or have not - changed (noting the important caveat that a 15-day period is far too short for comprehensive analysis).
Both emissions intensity and total emissions dropped significantly between 2011 and 2015. That can be attributed in large part to the decline in demand for grid based electricity in Victoria (~5600 megawatts for the period in 2011, 4900 megawatts for the period in 2015), along with an increase in wind generation (~100 megawatts for the period in 2011, ~260 megawatts for the period in 2015).
Of intrigue is the relatively low total emissions in 2013, which differs from the other years considered here in a being a year of carbon pricing (as I have discussed in previous posts). For now, the figure below helps with understanding, by showing how carbon pricing has impacted the structure of Victorian generation over the last few years.
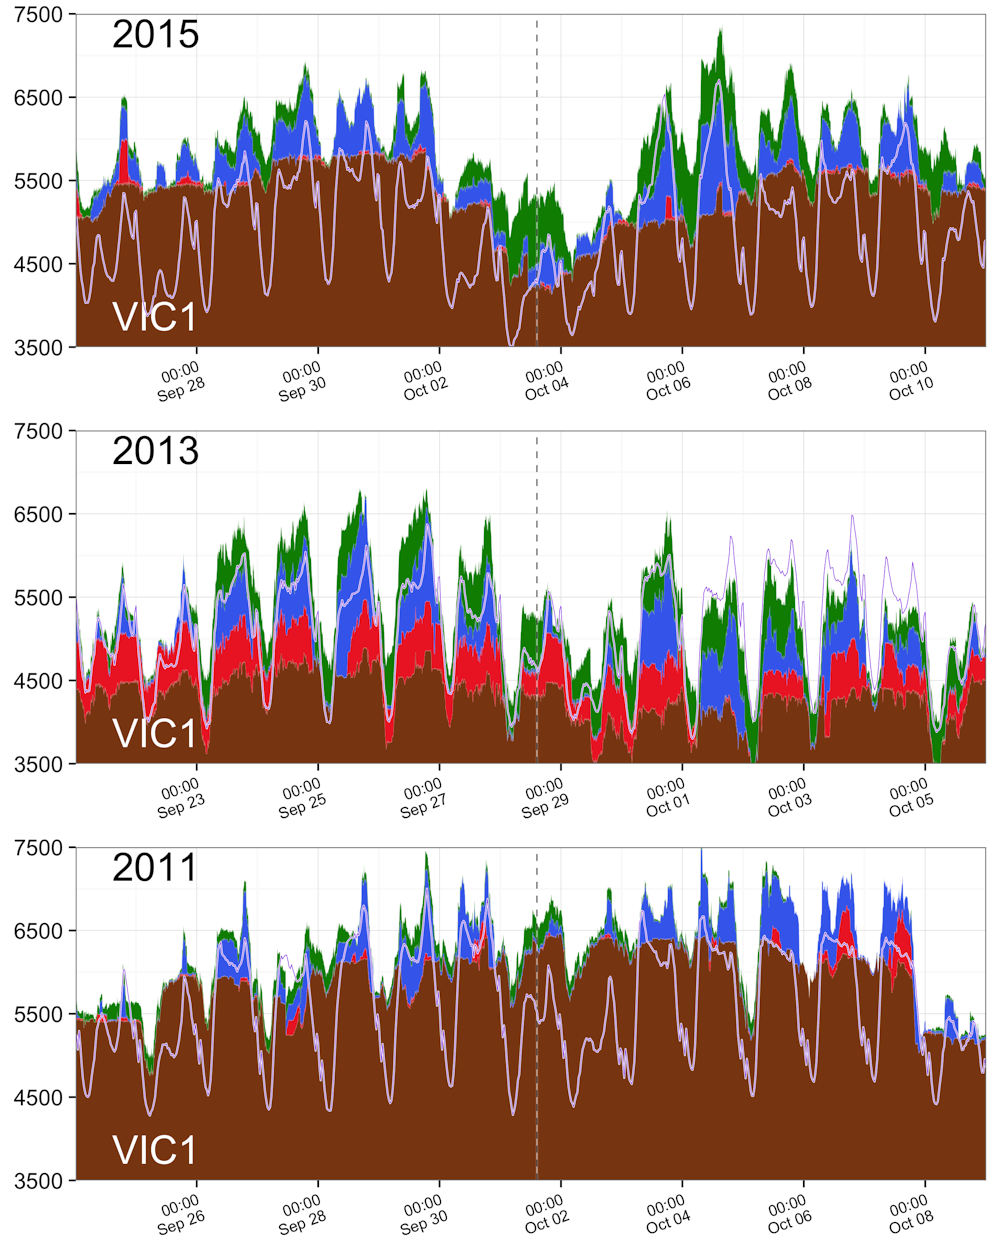
Two points are salient.
Firstly, average Victorian dispatch for the period in 2013 (5230 megawatts) was much lower than the equivalent period in 2015 (5900 megawatts). This is due to much lower exports from Victoria into the surrounding states in 2013 (about 100 megawatts) compared with 2015 (950 megawatts) despite Victorian demand falling by around 250 megawatts across the two years (from ~5150 megawatts in 2013 to ~4900 megawatts in 2015).
Secondly, gas generation was about 15 times higher for the period in 2013 (about 305 megawatts) than in the corresponding period in 2015, when gas dispatch achieved the miserable average of only about 20 megawatts.
Consequently brown coal generation rose over 20% from about 4300 megawatts in 2013 to 5300 megawatts for the corresponding period in 2015.
What is to be concluded?
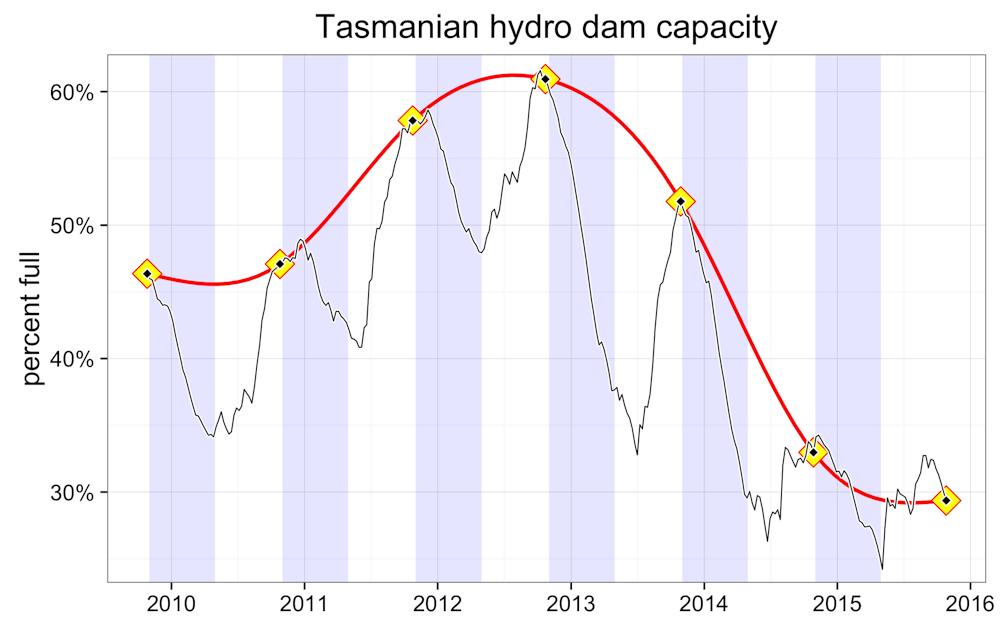
Firstly, without carbon pricing Victorian brown coal is back. Once again it is enhancing its traditional role as the backbone of power supply across the south-east Australian states. It has largely displaced gas in Victoria, some brown coal in South Australia, some black coal in New South Wales, and is now helping Tasmania restore its hydro capacity, albeit forlornly to date [see note 1].
Secondly, while wind is playing a role in reducing emissions in Victoria, its impact is still at the margins. As has been widely commented, given wind has a significant cost advantage of other renewables, there will be a need for more coherent and consistent policy settings if Victoria is to play its role in meeting the renewable energy target, and offsetting it egregious emissions profile.
Finally, what happens in Victoria impacts neighbouring states, especially Tasmania and South Australia. With those two states increasingly dependent on Victorian brown coal, the issue of inter-regional flows is becoming a potentially significant emerging issue that needs to be effectively addressed with trilateral policy settings. Currently the export of Victorian power is equivalent in amount to the output from the ageing Hazelwood power station in the Latrobe Valley - the most emissions intensive of our large power generators. Taking Hazelwood out of the equation would introduce significant pricing and security consequences for power supply across the neighbouring states.
Of course, currently underutilised Victorian gas generators would likely see opportunity in such adversity. But the bigger issue in need of policy coordination is how to deliver optimally to the challenges of energy security, affordability and environmental outcomes across all three states.
Notes
[1] At the time of writing, the latest data (26th October 2015) from Hydro Tasmania reports capacity now below 30%. This is despite Victorian generators pushing electricity across the Basslink interconnect at near maximum capacity over the last few weeks, providing for as much as 1/3 of Tasmanian demand. With late October to early November usually marking the annual peak in fill, dam levels are expected to progressively fall across the drier summer months. Historically they drain at a rate of a bit below 0.1% each day over the summer months, so without exceptional rainfall, there seems little alternative for Tasmania but to continue to source supply from Victoria for the foreseeable future. With current prices and policy settings, that means brown coal. In turn, that means Tasmanian power consumption is not nearly as clean as one might think.